Social Genetics
Genetic variation, group selection, and political behavior
by Charles Brack
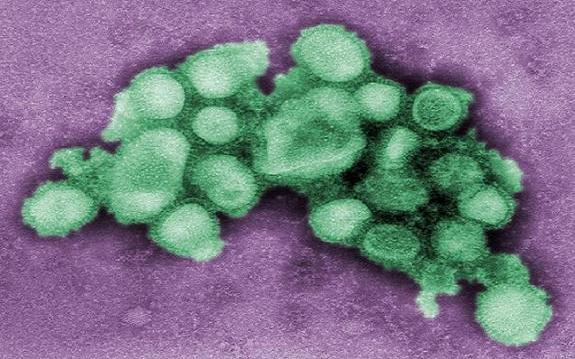
What does H1N1 tell us about the relationship between politics, epidemiology, and group selection?
In the book of scientific achievement, the development of genetics is certainly one of the more unseemly chapters. Gregor Mendel, the monk-scientist and contemporary of Charles Darwin, was the forgotten man in the decades-long battle for the theory of heredity, and only briefly recognized when he was invited to read his now-famous paper, Experiments in Plant Hybridization, to the Natural History Society of Brünn in 1865.
Mendel had laid the true scientific foundation for the controversial topic, something that Darwin would take a crack at with his ill-fated but influential Pangenesis theory, published just two years after Mendel's paper. Darwin never knew of Mendel, which pretty much sums up the general lack of enthusiasm that contemporary scientists had for Mendel's theories.
Only an ugly scandal of scientific originality would resuscitate Mendel from his appointment with eternal obscurity. Mendel was twenty years ahead of his time, and in an unusual convergence of scientific "intuition", his ghost was dug up in one of the more notorious episodes of scientific grave robbing. Hugo de Vries, like Mendel and Darwin, was trained in both science and religion, and would "rediscover" Mendel's theories of independent assortment, segregation, and dominance, which he packaged into his modified version of Darwin's Pangenesis theory in 1889.
However, it appears that de Vries was playing dumb when it came to the presumed priority of his discoveries. Carl Correns, like de Vries, would also rediscover Mendel's laws. As he learned of the work of de Vries and its priority over his, well, the party was over for all of the would-be fathers of genetics. Correns had nothing to lose, and called the imposters out. Mendel lived.
Which came first, the gene or the population?
But even Mendel would get bloodied by this new science of genetics. First, nothing seemed to add up. The morphological traits that were controlled by single genes worked well in Mendelian inheritance theory, but most phenotypic traits were controlled by multiple genes. Further, Mendel's data looked a little too perfect. In 1936, R. A. Fisher indignantly charged Mendel with tinkering with his own data. These were indeed fighting words, but given the general state of statistical funniness that constituted most genetic studies up to that time, it was certainly a reasonable accusation by Fisher.
But the difficulty of developing theories of heredity without the benefit of DNA would bog down even the most intuitive of scientists, including Darwin. Fortunately, Mendel was particularly curious about traits prominent in one generation, skipping the next generation, only to be found again in the grandchildren.
Correctly resolving this dilemma would set Mendel apart from the blending inheritance theories that prevailed at the time. Mendel's law of segregation was an analog for the process of meiosis, and when combined with Mendel's law of independent assortment, (which happened to only be true for non-linked genes), provided the rationale for the curious phenotypic expression of recessive genes that would skip generations.
But the unfortunate apathy that most contemporary biologists had for Mendel's work was understandable, given the enormous complexities involved in genetic expression. Mendel's theories only predicted a subset of traits that were associated with the expression of single genes. For phenotypic traits that had multiple genes and epigenetic influences, which were the large majority, Mendel's theories were of no immediate significance.
And this is where populations become particularly relevent to genes. For sexually reproducing species, no genes can survive without a population. Thus, the evolution of social behavior has a distinctive orientation towards preserving and expanding population gene pools. Although all gregarious species exhibit a spectrum of behaviors that facilitate the survival of population gene pools, when it comes to humans, this behavioral spectrum is anchored, on opposite ends, by conservatives and liberals.
The necessity of genetic variation
This brings us to the riddle of sexual reproduction, which Mendel inadvertantly stumbled upon in his laws of segregation and independent assortment. Sexual reproduction is by far the most common mode of reproduction among vertebrates, even though it only produces one-half of the offspring that asexual reproduction can accomplish, as sexual reproduction requires two sexes. In terms of energy efficiency of reproduction, sexual reproduction is only one-half as efficient as asexual.
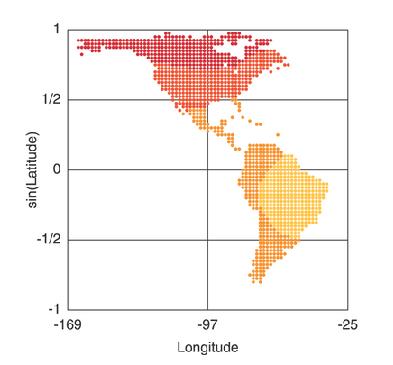
Heterozygosity and geographic distance from Africa. This image depicts the computed heterozygosity of Native American populations (from Wang, 2007). The darker the color, the higher the rate of heterozygosity in the population. The further north the population, the greater the rate of heterozygosity, indicating that migration reduces heterozygosity in the migrating population due to the founders effect, that is, smaller migrating subpopulations limit the genetic variation in new territories. This raises an interesting question: does north-south genetic variation in a species typically exceed east-west genetic variation?
The high cost of sexual production is compensated by the genetic and phenotypic variation it creates and sustains in a population. Genetic variation is one of the critical defenses a species has against extinction. On average, a decrease in genetic variation increases the probability of extinction. Genetic variation is commonly measured by the percentage of gene loci that are polymorphic, that is, heterozygous. Sexual reproduction maintains genetic variation in a population beautifully, and as the number of individuals in the breeding population expands, so does the probability of genetic variation.
However, we must be very careful to define the different faces of genetic variation, as it can be viewed from many perspectives: variation between individuals within a species; variation between individuals within a breeding subpopulation; variation between subpopulations in a metapopulation; variation within an individual's genome, etc. These diverse perspectives of genetic variation are all critical in the evolution of social behavior, and in the human case, political and religious behavior.
Four equations of genetic variation
The Hardy-Weinberg principle states that gene frequencies remain stable in a population from generation to generation without the disturbances of mutation, non-random mating, and selection. In the real world, it has limited applicability. However, it provides the foundation for studying genetic drive and drift, that is, disturbances to equilibrium gene frequencies within a population. Political and religious behavior are all about disturbing Hardy-Weinberg equilibrium.
Over time, given the Hardy-Weinberg principle, genetic variation (as measured by heterozygosity) within an individual's genome increases with the genetic variation in the breeding population. That is, over many generations, given random mating and the absence of selection, the genetic variation of each individual's genome will increase with the overall genetic variation in the population. However, political-religious behavior can provide a counteractive pressure.
Before we discuss social behavior and population genetics, let's define our algorithms for population and individual genetic variation. There are several options, as genetic variation within a population is commonly measured as the percentage of gene loci that are polymorphic (or the percentage of gene loci within an individual genome that are heterozygous). We will follow a related approach as illustrated below. While not optimal, it simplifies the more complex argument of base-pair variation across the entire genome.
Equation 1: Population genetic variation for a single gene locus g
Vg = 1 - (Sagi2/Ag2)
(where a denotes the total population frequency of each distinct allele (i) at locus g for the population, and A = total alleles for the population at locus g.)
Equation 1 example: At any given gene locus, we will define population genetic variation as the sum of squares of the population allele frequencies divided by the square of the total number of alleles. For example, a population of 100 individuals will have 200 total alleles at a given gene locus. If there are two distinct alleles, a1 and a2, and there are 140 a1 alleles, and 60 a2 alleles, total population genetic variation for a given gene locus will be 1 - ((1402 + 602) / 2002) = 0.42. If a population has n different alleles for a given gene, then population variation for that gene will be maximized when the population frequency of the alleles are all equal to each other (a1 = a2 = a3...). Genetic variation (Vg) = 0 when there is only one distinct allele for that gene locus.
Equation 2: Genetic variation for a single organism across all gene loci
Vo = 1 - (Sagi2/SAg2)
(where g varies from 1 to the total number of gene loci for that individual, a denotes the total frequency of each distinct allele (i) at locus g for that individual, and A= total alleles for the individual at locus g.)
Equation 2 example: As an example, let's say a organism has two gene loci in their genome. Further, let's presume there are two distinct alleles at gene locus 1, and only one distinct allele at gene locus 2. The equation reduces to: Vo = 1 - (12+12+22)/(22+22) = .25. When the organism is heterozygous at all gene loci, then variation reaches its maxmum at 0.5. When the organism is homozygous at all gene loci, variation reaches its minimum at 0.0.
Equation 3: Total population genetic variation across all gene loci
Vp = 1 - (S(agi-1)2/S(Ag-1)2 )
(where g varies from 1 to the total number of gene loci, and a denotes the population frequency of each distinct allele (i) for each locus g, and A = total alleles for the population at each gene loci g. We also subtract one from each frequency count to eliminate the interaction of the allele with itself.)
Equation 3: As an example, let's say a population of 100 individuals has just two gene loci in their genome, for a total of 200 alleles at each loci. Further, let's presume there are two distinct alleles at gene locus 1, with total population frequencies for the first allele a11 = 140 and a12 = 60. Since locus 2 is homozygous and the same allele for the entire population, the population frequency is 200. This equation reduces to: Vp = 1 - (1392+592+1992) / (1992+1992) = .21. The greater the number of distinct alleles, the higher the genetic variation. If there is just one kind of allele at each gene locus for everyone in the population, variation reaches its minimum at 0. If there are as many distinct alleles as there are total alleles for a population, then population genetic variation = 1.
Equation 4: Genetic variation between two populations, across all gene loci
Vx,y = S(ax - ay)gi2 / S(axgi2 + aygi2)
(where x denotes population x, y denotes population y, a denotes the total population frequency of each distinct allele (i) at locus g for the population.)
Equation 4 example: As an example, let's say two populations, x and y, of 100 individuals each, have just one gene locus in their genome, for a total of 200 alleles at that locus i. Further, let's presume there are two distinct alleles at this gene locus, with total x population frequencies for the first allele a11 = 140 and a12 = 60. For population y, let's presume that allele frequencies are a11 = 50 and a12 = 150. This equation reduces to: Vx,y = ((140-50)2+(60-150)2) / (1402+602+502+1502) = .33. If there are no common alleles between population x and population y, then variation reaches its maximum at 1. If each population has equal frequencies among their unique alleles, variation reaches its minimum at 0.
The first hypothesis of political conflict
From the equations above, we can derive special cases with political ramifications. First, let's consider the case of conservative-liberal political conflict. Let's start with a metapopulation that contains two subpopulations, conservatives (x) and liberals (y), with a total metapopulation size = P. (Let's ignore other political orientations, although they provide an interesting variation on this simple model).
In this case, P = Px + Py, where Px = the size of the conservative subpopulation, and Py = size of the liberal population. Given any degree of genetic variation between conservatives and liberals, which is certainly true in the United States, equation 4 tells us that total genetic variation between conservatives and liberals (Vx,y) will increase until Px = Py. That is, genetic variation increases as the size of the subpopulations of conservatives and liberals converge towards equality.
The significance of this lies in the relationship between political conflict and genetic distance. The first hypothesis of political conflict, and animal conflict in general, is that it changes with genetic distance. Thus, political conflict between any two subpopulations, such as conservatives and liberals, which we shall refer to as Cx,y, is a partial function of the genetic variation as expressed by equation 4.
Thus, the mathematical expression of the first hypothesis of political conflict can be expressed as:
∂Cx,yThe first hypothesis of political conflict> 0 ∂Vx,y
This equation could easily be constructed to describe the political conflict between ethnic groups, and indeed, the divergence in the ethnic composition of conservatives and liberals in the United States is dramatic. If we have a nation with multiple political (or ethnic) groups, then total political conflict within the metapopulation will increase as the subpopulation sizes of the political (or ethnic) groups converge to be equal with each other.
This raises a number of issues, the first being the measurement of political conflict. How do we do this? Our formal definition of political conflict is the energy expended to change one or more of the following variables: income distribution; health care expenditures; environmental protections; reproductive regulations; military expenditures; military operations; territorial expansion or contraction; migration policies; redistricting; and, economic regulations.
Secretly, political conflict induces genetic drive, or changes in population gene frequencies. However, measuring energy has obvious problems, therefore, we can use money as a proxy. The money spent on campaign contributions, lobbying, political advocacy groups, political action committees, bribes, etc., would be a better estimator, although it does not capture the high rates of volunteerism that typically correlate with high levels of political conflict.
Therefore, all other things equal, the above equation predicts that the money spent on political conflict will increase with increasing genetic variation, all other things being equal. This certainly seems to be the case in the United States, as the relative decline in the white population has correlated with increasing per capita expenditures on political conflict. This equation also predicts the political conflict associated with genetic variation will increase as the rapidly growing Hispanic population increases relative to the white population.
However, this does not mean that total political conflict will necessarily increase, as there are indeed many countervailing tendencies. But given the relationship between political conflict and genetic variation, we can see the dilemma of species: genetic variation improves the probability of survival, increases the rate of intraspecies conflict, and increases the rate of evolution (Fisher, 1930). Human political conflict is just one variation of the general model of animal conflict.
Before we discuss the subtleties of genetic variation and social behavior, let's take a look at what has been going on with the curious natural selection of human species.
Disease, cancer, testicles, and evolution
While most accounts have focused on the increased capacity of the brain as being the major byproduct of human evolution, the genetic evidence is actually pointing a bit lower.
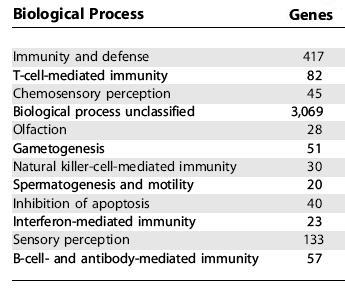
Human genes under selective pressure. This graph depicts the human genes under selective pressure (Nielsen, 2005). Note the large number of genes associated with immune system function, tumor suppression, apoptosis, spermatogenesis, and sensory perception. Interestingly, genes with maximal expression in the brain show little change when compared to chimpanzees. Genes associated with the X-chromosome have also been under selective pressure.
The surprising results of the Nielsen study (2005) indicate a very hidden face to natural selection. While humans have battled both the environment and other humans in their quest for survival, we have been fighting a very quiet and difficult war at the level of the cell and the genome. The large number of genes devoted to disease, cancer, apoptosis, and spermatogenesis indicate that this hidden war is actually on par with the struggle with the environment (and other humans).
This raises some of the more intriguing questions of human evolution: is social behavior partially under the spell of the hidden war waged quietly at the level of the cell and the genome? Is the evolution of the immune system intertwined with the evolution of social behavior?
Xenophobia and the immune system
Social behavior has been implicated in immune system function, primarily via social avoidance and ethnocentric behaviors that decrease the probability of contact with communicable diseases from other ethnic groups. In fact, those that feel most vulnerable to contagious diseases are more likely to react negatively to outgroups (Faulkner, 2004). Prejudice against those with physical disabilities has been proposed to have evolved as a disease-avoidance mechanism by Park (2003).
Further evidence for the relationship between xenophobia and the immune system comes for Navarette (2007), who found that women in the first trimester of pregnancy are elevated in their negative attitudes towards outgroups. The first trimester is accompanied by a down-regulation of the female immune system to facilitate fetal development.
In regions with historically high levels of infectious diseases, people report lower levels of sociosexual behavior and extraversion (Schaller, 2008). This, by itself, places an evolutionary value on reducing the numbers of sex partners in high risk environments, which also translates into reduced average rates of genetic variation in any individual genome (equation 2) relative to the genetic variation in the metapopulation (equation 3).
As we have previously indicated (see Sociosexuality), conservatives of both genders have fewer sex partners than liberals. However, within a population, the relationship between sex partner number and individual heterozygosity is no doubt loose one.
One of the more interesting and recent hypotheses on the origin of religious splintering involves a proposal by Fincher and Thornhill (2008), suggesting "that the genesis of religions has varied spatially across the globe because religion manifests from evolved behavioural strategies for the avoidance and management of infectious disease."
Fincher and Thornhill propose an interesting relationship between religion diversity and disease richness, due to an evolutionary trade-off of low population genetic distance to retain coadapted gene complexes that work well against local diseases, versus the general maladaptation of inbreeding. The associated pressure of infectious disease diversity reduces both intergroup contact and genetic diversity, which is subsequently reflected in the diversity of religions.
The evidence is pointing to a substantial co-evolution of the immune system with the genetics associated with social behavior, and seen as shyness, negative implicit attitudes associated with disease avoidance, and the enhanced propensity for spiteful and indifferent behaviors towards genetic distance. That is, certain social behaviors contribute to the modulation of the exposure to communicable diseases.
Genetic diversity, disease resistance, and epidemics
However, in other species, there is some interesting evidence that implies a survival value to exposure to conspecifics that have previously been immunized. Traniello et al. (2002) noted that dampwood termites "significantly improve their ability to resist infection when they are placed in contact with previously immunized nestmates." How this "social immunization" theory applies to humans certainly depends on a large number of variables, but the hypothesis that modulated social contact can be immunologically beneficial certainly might facilitate high population densities in humans.
The value of genetic diversity in a population can be substantial, and best seen in disease resistance and the ability of a population to survive epidemics. But this relationship is far from linear. Springbett et al. (2003) noted several interesting benefits associated with increased population genetic heterogeneity: decreased duration of epidemics; decreased mortality rates; and, an overall decrease in the severity of epidemics.
Further, in an unusual coincidence with the theory of political conflict between ethnic subpopulations, Springbett noted that, in a metapopulation, "the beneficial impact [i.e., the reduction in numbers of infected individuals from an epidemic] of heterogeneity is at a maximum when subgroup sizes are equal or approximately equal".
In other words, the minimization of the infection ratio of an epidemic occurs at the same point where the political conflict between two subpopulation is maximized: when ethnic subpopulations are equal in number.
If the genetic variation of a metapopulations increases (equation 3), over time, it increases the pressure on genetic variation among the individuals within that metapopulation (equation 2). The disease resistance value of genetic variation at the individual level is significantly positive.
This has been noted in many species, such as rainbow trout (Ferguson, 1990), pigs (Henryon, 2001), and cattle (Lewin, 1989). In fact, major histocompatibility complex (MHC), the most gene-rich section of the human genome, is one of the major reasons for the wide diversity of the immune system. Interestingly, MHC allele frequencies vary by racial group.
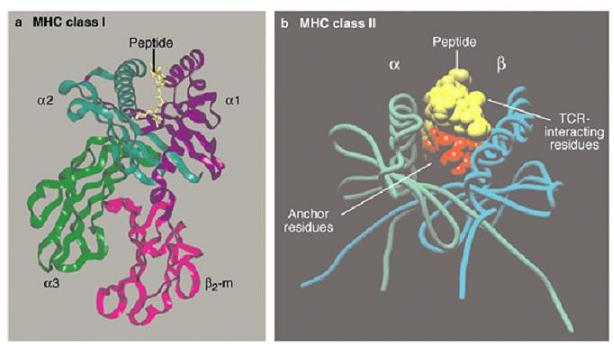
Major Histocompatibility Complex (MHC): a hidden clue to human social behavior? MHC is a major contributor to the human immune system, and one of the most polymorphic regions of the genome. This hints at a population-gene interaction, where large numbers of unique alleles at the same locus (equation 1) distributed throughout a population increases the probability of species survival. Interestingly, polymorphism is also high with genes that contribute to human behavior.
A case for group selection
The diversity of the immune system, where unique alleles are spread across a population, rather than being overloaded on to the same individual genome, is one of the more interesting events in evolution. It is perhaps an excellent case for the hotly contested theory of group selection, that is, selection of genes at the level of the population, as opposed to the phenotype.
Communicable disease may best be defended by a distribution of unique alleles across a population. That is, a larger set of distinct alleles spread across a population may provide greater survival rates to epidemics than overloading an individual's genome with the same set of unique alleles.
MHC loci exhibit unusually high levels of heterozygosity (Lewin, 1989). Extreme polymorphism at MHC loci has been proposed to be maintained by natural selection at the level of the population. One such mechanism involves the hypothesis that certain pathogens acquire MHC antigens from their primary host, subsequently carrying them to the next host, which will benefit by genetic variation in the MHC, which will treat the pathogens with the hitchhiking MHC antigens like intruders (Andersson, 1987). Had the next victim had identical MHC alleles as the first, the pathogens would be harder to detect and eliminate.
Given the advantages of extreme polymorphism distributed throughout a population in disease resistance, the arms race between the human immune system and the rapidly evolving microbial world may be an excellent approach for a theory of group selection. Interestingly, some gene loci associated with behavior, such as the dopamine receptor genes, exhibit elevated numbers of unique alleles spread across a population. The unusual variation in human behavior may also constitute a rare opportunity for a theory of group selection.
Conservatism, liberalism, and group selection
Darwin's prolific cousin, Francis Galton, the first behavioral geneticist, was also one of the first Social Darwinists. Galton was very much against social welfare and income redistribution that increased the reproductive capacity of the poor and unhealthy. This conforms quite closely to contemporary conservatism, as is highlighted by the health care debate in the United States.
The dichotomy of conservative and liberal social behavior fundamentally supports two modes of genetic variation. In the United States, this is seen in the growing genetic divergence between the Caucasians in the Republican Party, and the wide ethnic diversity of the Democratic Party.
Liberals organize their prosocial behavior across greater genetic distance, and as such, have a stronger propensity to facilitate and retain greater genetic distance in their social groups. Conservatives are less likely to facilitate and retain genetic distance in their social groups, and engage in more conflict with competing social groups as genetic distance increases (equation 4).
Therefore, we propose that liberal political attitudes maintain higher levels of genetic variation in a population (equation 3), higher average rates of genetic variation at any particular gene locus in that population (equation 1), and higher average levels of heterozygosity within any particular individual's genome (equation 2).
The liberals certainly seem to be flirting with the contentious evolutionary theory of group selection. Their tolerance of genetic diversity and voluntary reduction of reproductive rates makes a better case for group selection than does conservatism. Conservatives, especially the nonreligious variety, fall closer down the line of the more popular theory of phenotypic (individual) selection. However, the high levels of altruism displayed by religious conservatives (to those within their religious groups) certainly is a candidate for group selection, albeit at lower genetic distance than the secular liberals.
As the United States continues down its pathway of greater genetic diversity, we can expect the trend of increasing political conflict to continue, at least until the Hispanic and Caucasian populations reach parity. And as we suffer through the epic political battles that will no doubt ensue, at least we'll be better positioned to fight off the microbes.
Charles Brack, March 2010
References:
L. Andersson, S. Pääbo, and L. Rask (1987) Is allograft rejection a clue to the mechanism promoting MHC polymorphism? Trends in Immunology, Volume 8, Issue 7, 206-209, 1 January 1987
J. Faulkner, M. Schaller, J. Park, and L. Duncan (2004) Evolved Disease-Avoidance Mechanisms and Contemporary Xenophobic Attitudes. Group Processes & Intergroup Relations, Vol. 7, No. 4, 333-353 (2004)
M. Ferguson and L. Drahushchak (1990) Disease resistance and enzyme heterozygosity in rainbow trout. Heredity. (1990) 64, 413–417.
C. Fincher and R. Thornhill (2008) Assortatitve sociality, limited dispersal, infectious disease and the genesis of the global pattern of religious diversity. Proc. R. Soc. B doi:10.1098/rspb.2008.0688
R. Fisher (1930) The Genetical Theory ofNatural Selection. (Clarendon, Oxford).
M. Henryon, P. Berg, J. Jensen, and S. Andersen (2001) Genetic variation for resistance to clinical and subclinical diseases
exists in growing pigs. Animal Science 2001, 73: 375-387.H. Lewin (1989) Disease Resistance and Immune Response Genes in Cattle: Strategies for their Detection and Evidence of their Existance. Journal of Dairy Science 72 (5): 1334.
C. Navarrete, D. Fessler, S. Eng (2007) Elevated ethnocentrism in the first trimester of pregnancy. Evolution and Human Behavior 28 (1): 60–65
R. Nielsen, C. Bustamante, A. Clark, S. Glanowski, T. Sackton, et al. (2005) A scan for positively selected genes in the genomes of humans and chimpanzees. PLoS Biol3(6): e170.
J. Park, J. Faulkner, and M. Schaller (2003) Evolved Disease-Avoidance Processes and Contemporary Anti-Social Behavior: Prejudicial Attitudes and Avoidance of People with Physical Disabilities. Journal of Nonverbal Behavior. Volume 27, Number 2 / June, 2003,
M. Schaller, D. Murray (2008) Pathogens, personality, and culture: Disease prevalence predicts worldwide variability in sociosexuality, extraversion, and openness to experience. Journal of Personality and Social Psychology 95 (1): 212–221
A. Springbett, K. MacKenzie, J. Woolliams, and S. Bishop (2003) The Contribution of Genetic Diversity to the Spread of Infectious Diseases in Livestock Populations. Genetics. 2003 November; 165(3): 1465–1474.
J. Traniello, R. Rosengaus, and K. Savoie (2002) The development of immunity in a social insect: Evidence for the group facilitation of disease resistance.
S. Wang S, C. Lewis Jr, M. Jakobsson, S. Ramachandran, N. Ray et al (2007) Genetic variation and population structure in Native Americans. PLoS Genet 3(11): e185. doi:10.1371/journal.pgen.0030185.