
The Curious Case of the January 2019 Jobs Report
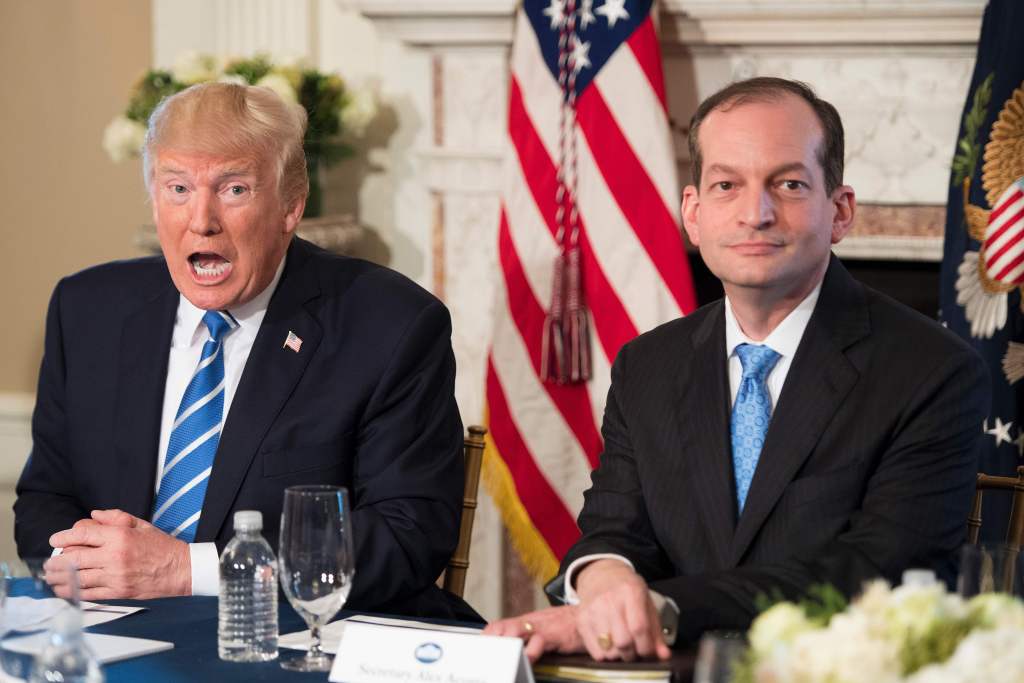
Alex Acosta gave a controversial plea deal to Trump friend Jeffrey Epstein
So Trump got away with one. It certainly wasn’t the first time he’s violated some law and walked off like he did everyone a favor. But this was right in our faces. On national TV. And after his crime spree, he blamed everyone else. And got away with it. And then his rally Trumpers were screaming to lock up the people doing the investigation.
But given Trump’s interference inside the Department of Justice, how can we trust anything his administration produces? Especially the economic data. Is Trump putting pressure on the Bureau of Labor Statistics (BLS) to produce favorable jobs reports?
And if he is browbeating the BLS, are they bending the numbers for him? It’s easy to see how Trump views a strong economy. He believes it will give him a pass with his neverending legal troubles.
Apr 23, 2019 Tweet: “You mean the Stock Market hit an all-time record high today and they’re actually talking impeachment!? Will I ever be given credit for anything by the Fake News Media or Radical Liberal Dems? NO COLLUSION!”
Apr 23, 2019 Tweet: ‘In the “old days” if you were President and you had a good economy, you were basically immune from criticism. Remember, “It’s the economy stupid.” Today I have, as President, perhaps the greatest economy in history...and to the Mainstream Media, it means NOTHING. But it will!’In Trump’s mind, the performance of the economy should give him legal immunity. So would we expect Trump to pressure the Bureau of Labor Statistics to pump up the numbers for him? Absolutely. Look at what he has done with the Justice Department in plain sight. Surely, finding a nice, quiet way to pressure Alex Acosta and the BLS is absolutely nothing to him.
And it wouldn’t be the first time a president has attempted to manipulate the jobs report. Richard Nixon was convinced that the assistant commissioner of the BLS, Harold Goldstein, was not spinning the numbers to his liking, and ordered a reorganization of the BLS. Goldstein was demoted, and a “sensitive and loyal Republican” was designated to replace his duties. Nixon also ordered a count of the numbers of Jews and Democrats in the BLS, as he was convinced they were sabotaging the job numbers leading up to the election. On a White House recording, Nixon, in reference to the BLS, said “are they all Jews over there?”.
Of course, this is insane, right? Who would be so crazy as to question the job numbers as being a political tool of the president? Who would be so conspiratorially inclined as to question the government numbers on jobs?
Donald Trump. And he was the greatest BLS conspiracy theorist of them all. Trump claimed nineteen times that the unemployment numbers were fake, and in August 2016, prior to his election, he claimed that the “real unemployment rate is 42 percent”.
Trump’s criticism of the jobs report peaked in late 2012, when the September report showed a reduction in the unemployment rate from 8.1% to 7.8%. This caused an explosion on the right wing, and a news report in the New York Post claimed that employees in the Philadelphia office of the US Census Bureau were cooking their interviews to help Obama. The Inspector General investigated the incident, and found no evidence of the accusation. But no one on the right side of the political spectrum believed a word of it, including Trump.
Trump parroted a Forbes report by Peter Ferrara in a tweet: “census workers cooked the job numbers for Obama right before the election”. And this was perhaps the first time that Trump realized that the unemployment rate is just an extrapolation of a small sample of about 60,000 households. His head must have been spinning. Sampling. Music to the ears of someone like Trump, who has built a career on creative accounting. With sampling, you could get away with murder. But the question is, did this sublime magic of the jobs report stick in his mind when he became president?
But let’s go back to January 2017, when Trump was sworn in as the 45th president. Dr. Erica Groshen, a registered Democrat and economist, was completing her four year term as commissioner of the BLS, and was replaced by another career BLS economist, deputy commissioner William Wiatrowski, a registered Republican. Alex Acosta, an attorney and one-time federal prosecutor for the Southern District of Florida, which included Trump’s southern Florida business operations, also had jurisdiction over the controversial Jeffrey Epstein case. Acosta was approved as Secretary of Labor on April 27, 2017, and took oversight of the BLS the same day.
2017, the first year of Trumponomics
2017, the first year for Trumponomics, focused mainly on Trump’s executive orders, several of which targeted reductions in government regulations, which were supposed to stimulate the economy. EO 13771 was one of the first executive orders signed by Trump, which was titled “Reducing Regulation and Controlling Regulatory Cost”, the famous “one-in, two-out” rule for regulations. Let’s take a look at some key data points from the BLS Monthly “Employment Situation” report, which is where the “unemployment rate” and “nonfarm payroll employment growth” numbers come from.
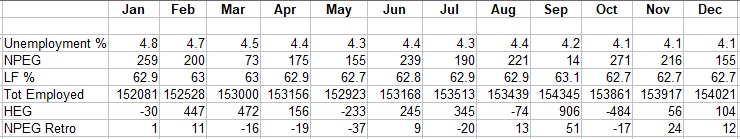
Selected BLS 2017 Economic Data (in thousands) We have selected six statistics from the jobs report, the Unemployment %, or unemployment rate. Next is the NPEG, which is nonfarm payroll employment growth. LF % which is the labor force participation rate. Roughly, this is the percent of the population that has a job, or is actively looking for one.
Next, we have Tot Employed, which is Total People Employed. These are the people that currently have a full or part time job. Then we have HEG, which is the Household employment growth. This should not be confused with NPEG, as it comes from a completely different survey source, as we shall explain later. Further, unlike NPEG, this number includes farm employment, self-employment, and family business employment.
And finally, we have NPEG Retro which is nonfarm payroll employment growth first month's retro adjustment. This is a somewhat complicated statistic, but it is critical in our later discussion about the unusual behavior of the BLS. The BLS retroactively adjusts the NPEG in the two months that follow the original report.
The reader might be surprised that there is no connection between the unemployment rate and NPEG, the two most quoted statistics from the jobs report. They come from two different survey sources. NPEG comes from the Establishment survey, and HEG and the unemployment rate come from the Household survey. Focusing on the above chart, let's review the 2017 data for trends associated with the Trump presidency.
First, we must note that January still belongs to Obama, as Trump was not sworn in until January 20, and provides the baseline data for the Trump era. The unemployment rate was 4.8%, and nonfarm payroll job growth as 259,000. Now, arguably, most economists would ascribe the data for the next two months to Obama’s tenure, but Trump happily takes credit for the immediate decrease in unemployment, so we’ll give the devil his due.
But the unemployment rate, which had a distinctive downward trend in 2015, had no such trend in 2016. But it goes down immediately after Trump’s inauguration. We have no evidence that this was “instigated” by some sort of pressure that Trump waged against the BLS. It could be a valid downward trend. But this instant decrease in the unemployment rate is hard to explain as being the result of Trump’s policies, as February and March experienced a combined HEG employment growth of 919,000 (447,000 from Feb + 472,000 from Mar).
This is a big number, and out of line with NPEG of 273,000 for those months. As you can see, there are stark differences between NPEG and HEG. How can that be?
Now is a good time to go over the basis for these numbers. They are samples from two different populations. As previously noted, the unemployment rate comes from something called the Household survey. The NPEG comes from the Establishment survey. We’ll use the explanation in the April, 2019 jobs report to explain the difference:
“The household survey and establishment survey both produce sample-based estimates of employment, and both have strengths and limitations. The establishment survey employment series has a smaller margin of error on the measurement of month-to-month change than the household survey because of its much larger sample size. An over-the-month employment change of about 100,000 is statistically significant in the establishment survey, while the threshold for a statistically significant change in the household survey is about 500,000. However, the household survey has a more expansive scope than the establishment survey because it includes self-employed workers whose businesses are unincorporated, unpaid family workers, agricultural workers, and private household workers, who are excluded by the establishment survey.”
Okay, so the vaunted unemployment rate, which is treated like an undeniable truth by much of the media, is really, by their own admission, somewhere around there. Note that the large jumps in HEG for February and March are not that unusual, as there is a long history of wild spikes in this statistic.
Further, the Household survey “is a sample survey of about 60,000 eligible households conducted by the U.S. Census Bureau for the U.S. Bureau of Labor Statistics (BLS).” Okay, so it’s “about” 60,000 eligible households. Now, the report does not explain what “eligible” means, so at this point, we are simply left to wonder. Are homeless populations eligible? No explicit details of the Household samples are found in the report, and changes in the determination of eligibility or sampling methodology can swing the unemployment rate up or down.
The Establishment survey “surveys about 142,000 businesses and government agencies, representing approximately 689,000 individual worksites, in order to provide detailed industry data on employment, hours, and earnings of workers on nonfarm payrolls. The active sample includes approximately one-third of all nonfarm payroll employees”.
Now there is an important point here. First, the Establishment survey can count people twice. If they have two jobs, they are counted twice. This number is about 5% of the workforce, so it is not insignificant, and provides an upward bias in the job number that persisted long before Trump took office.
Another important point to consider is that “(f)or both surveys, the data for a given month relate to a particular week or pay period. In the household survey, the reference period is generally the calendar week that contains the 12th day of the month. In the establishment survey, the reference period is the pay period including the 12th, which may or may not correspond directly to the calendar week.”
Keep this in mind. The 12th day of the month. This becomes critical when we review the BLS treatment of the Federal shutdown in December 2018 versus how they handled the October, 2013 shutdown.
Now, the first four full months of Trump’s presidency, we see the unemployment rate steadily decrease through May, where it reaches 4.3%. Note that May 2017 also showed a sizable dip in the “labor force participation rate”, which is simply the total labor force (employed + unemployed persons) divided by the population. And if ever there was a statistic that could be easily manipulated to artificially decrease the unemployment rate, this is it.
And for May, notice the very strange dip in HEG of -223.000, while the unemployment rate decreased by 0.1%. NPEG grew by 155,000 that month, showing another wide swing between the supposedly correlated statistics. The drop in the unemployment rate was because the number of people in the labor force dropped, and not because jobs were added, at least according to the Household survey.
But June through August aren’t too unusual, as the unemployment rate hangs on at 4.4% despite some noise in the Household survey. And then we get to September 2017. Not only do we see a huge jump in HEG of 906,000, we also see a jump in the labor force participation rate, from 62.9% to 63.1%. The NPEG for September was only 14,000, so the difference between the two (892,000) is the highest in the Trump presidency.
The problems with the September 2017 Household employed are clearer when looking at the next month, October, which shows a drop in Household employment of -484,000 indicating that the September number was likely a “sampling error”. But that sampling error worked to Trump's advantage, as it dropped the unemployment rate to 4.2%.
The other strange behavior for October is the steep decline of the labor force participation rate from 63.1% in September to 62.7% in October, further dropping the unemployment rate to 4.1%, despite the huge decline of HEG by 484,000. Consistent with the theory that September was a statistical fluke for the Household survey, October, November, and December are all 62.7%.
But we are not yet making any assertion of malfeasance by the BLS. It could very well be explainable “noise” that persists in any sampling methodology. But note that Trump gets to a 4.1% unemployment rate in October, and holds it for six consecutive months, until April, 2018. An unemployment rate held for that long is indeed unusual.
2018 - Trump's Tax Plan and Tariffs go into Effect So far, we can make no assertions of improprieties in the 2017 BLS reporting, although we indeed have some very large disconnects between NPEG and HEG, and a decline in the labor force participation rate from 62.9% in January to 62.7% in December, which helps reduce the unemployment rate slightly. But Trump's tax plan is about to go into effect in 2018, so let's take a look at that year.
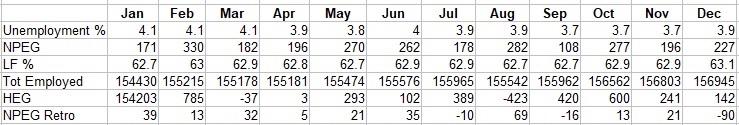
Selected BLS 2018 Economic Data (in thousands)
Please note that Trump has to deliver his first State of the Union (SOU) address on January 30, 2018, and the unemployment rate did not change from the previous month. But in his SOU address, Trump highlighted data not just in the BLS jobs report, but from another department under the Department of Labor, known as the Employment and Training Administration. “Unemployment claims have hit a 45-year low. African-American unemployment stands at the lowest rate ever recorded, and Hispanic American unemployment has also reached the lowest levels in history.”
Now the citation of the 45-year low of unemployment claims is a bit deceptive, as there has been a decades long trend of decreasing unemployment claims due to several secular factors: the decline of unionization and manufacturing occupations as components of the labor force, the increase in the public sector, the advent of ACA, changes to the rules regarding eligibility, and demographic shifts.
But more importantly, Trump went on further to claim that the tax cuts, effective January 1, would “create new jobs”. Trump’s tariffs were also rolled out, beginning January, so Trumponomics was fully in the crosshairs of its critics. The BLS jobs reports naturally became critical for Trump’s justification of a tax plan that favored the rich, not to mention his legal problems that seemed to mount with each passing news cycle. But the 4.1% unemployment rate inherited from 2017 would prove to be sticky, and lasted through March, 2018.
But not NPEG. It hit 330,000 in February, the highest number in the Trump era, and beating his previous record by 40%. Quite a jump, and in just the second month of his tax plan. And to add more fuel to Trump’s fire, HEG for February was 785,000. But despite these big jumps in employment growth, the unemployment rate in February was still stuck at 4.1%, one of the culprits being an increase in the labor force participation rate, wiping out the impact of the growth in HEG.
But neither March or April would demonstrate the great benefits of the Trump tax plan, as NPEG was an unexciting 182,000 and 196,000, and HEG was less than zero (-37,000 and 3,000), which would indicate a probable statistical problem with February. So what was with February? A statistical blip in both the Household and Establishment surveys? Or a sign of the BLS buckling under the pressure of Trump? We can’t say for sure, but later in the year, we have very good circumstantial evidence that the BLS is painting the tape for President Trump.
But finally, there was relief for the tax plan, as April 2018 came in at 3.9%, a 0.2% dip of the unemployment rate, and below the so-called “full employment” level of 4%. This was a great moment for Trump and his tax plan, and was not warranted by the meager HEG of 3,000 for that month. It was more the product of a small decrease in the labor force participation rate, from 62.9% to 62.8%.
The Trump tariffs continued their roll out in 2018, and there was indeed a downward trend in the unemployment rate, hitting 3.7% in September, and sticking until December, where there was an uptick to 3.9%. So after a full year of Trumponomics, what was the scorecard?
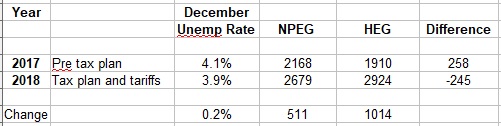
2017 vs 2018: Pre and post Trump tax plan/tariffs (in thousands)
From 2017 to 2018, we see an elevation in both HEG and NPEG. Also note that the jump in HEG was almost twice that of NPEG, and in the same direction of the “statistical significance” difference between the two surveys, which BLS pegs at “about” 100,000 for NPEG, and "about" 500,000 for HEG. But while they are not exactly sampling the same population, we notice HEG for 2018 outstripped NPEG by a about the same amount that would account for the unemployment decrease of 0.2%.
While we are not accusing malfeasance on the behalf of the BLS, the HEG is more easily manipulatable than the NPEG for a variety of reasons. And interestingly, HEG bends more in Trump’s favor than the NPEG. But this elevation in HEG may simply be an above board statistic with no deliberate bias. But let’s push on, and get to the meat of our case against the BLS jobs report.
Evidence for BLS Tinkering of the Jobs Report
Keep in mind that Donald Trump was originally scheduled to give the State of the Union address on January 29, 2019. Also keep in mind that the December 2018 jobs report would be the last one before Trump was scheduled to speak before Congress. Trump was obviously hoping for a good report, which was reported on January 4, 2019. And indeed, it was a good one.
The December 2018 report came in at 312,000 nonfarm payroll jobs. Note that the above table shows 227,000 for NPEG for December. This is the "corrected" number. The original number reported was 312,000. And ironically, the unemployment rate jumped from 3.7% in November to 3.9% in December. This inconsistency again correlated with a jump in the labor force participation rate, which went from 62.9% in November to 63.1% in December.
So the NPEG of 312,000 was good, but since it was also accompanied with 419,000 new people coming into the labor force, according to the Household survey, the unemployment rate still went up. But it was still under 4%, and would still provide a good talking point on Trump's upcoming SOU address. So was the BLS serving up a good NPEG number for Trump’s address?
But Trump would never get to use the December 2018 jobs report in the SOU, as the Federal shutdown took effect on December 22, 2018, and the SOU, which was scheduled on January 29, was postponed. So much for the favorable December jobs report becoming a key talking point for Trump. And it was a good one. After all, the December NPEG was only the second time in Trump’s twenty-four month tenure that it cracked 300,000.
This was terrible luck for Trump. His SOU was postponed until February, so he’d have to face down another BLS report for January, 2019, which might not be so good. After all, what were the odds he’d get another 300,000 number the next month?
I mean, we are already at a 3.9% unemployment rate, how could the economy even add that many jobs, especially when there were 380,000 Federal workers that were furloughed, and would need to be counted as unemployed based on the very explicit rules set by the BLS themselves. After all, Trump caused the shutdown. He should suffer, right? And he’s not above the longstanding traditions and guidelines of BLS employment reporting. Is he?
Trump is staring down one of the worst jobs report in recent history It was an impossible situation. With the shutdown and the furloughed Federal employees that would have to be counted as unemployed, Trump was headed towards a disastrous jobs report. The worst of his tenure. One of the worst in recent history. And right before his SOU. So what happened?
On February 1, four days before Trump was to give his rescheduled SOU address, the January, 2019 report was released, and the first sentence of the report was:
“Total nonfarm payroll employment increased by 304,000 in January, and the unemployment rate edged up to 4.0 percent, the U.S. Bureau of Labor Statistics reported today.”
For the second straight month, and four days before Trump’s SOU, NPEG topped 300,000.
What Federal shutdown? Now there is a lot of very interesting verbiage in the January 2019 jobs report regarding the BLS handling of the Federal shutdown and its impact on the statistics, but remember that great December 2018 report that reported the big NPEG of 312,000?
Whoops. Umm, nevermind. We made a slight mistake. It happens. The BLS makes retroactive adjustments to previously reported numbers. And that original 312,000 that appeared right before the regularly scheduled SOU? Well, here’s what the BLS said in the January report about the December NPEG:
“The change in total nonfarm payroll employment for November was revised up from +176,000 to +196,000, and the change for December was revised down from +312,000 to +222,000. With these revisions, employment gains in November and December combined were 70,000 less than previously reported.”
So December NPEG was knocked down from 312,000 to 222,000, or a reduction of 90,000 jobs. At first blush, this seems like a rather large downward adjustment. Is this normal? NO. Statistically, it's quite rare.
As of the date of this article, we computed the first month’s retroactive adjustment of NPEG for each BLS report, called "NPEG Retro" on the tables. So if the month of the BLS report is for February, the “first month’s retroactive adjustment” would be the revision of the previous month’s NPEG, which would be January’s. (Note that the BLS makes two months of retro adjustments for NPEG, but we are only considering the first retro adjustment in this analysis.)
We computed the mean and standard deviation of NPEG’s first month's retro adjustment for the entire Trump era, to date. Since we are asserting that the BLS cooked up the NPEG for December 2018 to help Trump before the January SOU, and that they subsequently covered their tracks the next month by cutting it back down by 90,000 jobs, we should expect to see implausible data trends.
Here are the first month’s retro adjustments for the Trump era.
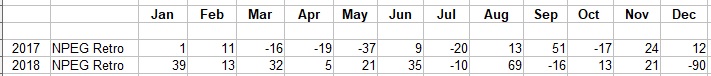
First Month's BLS Adjustment of Retro NPEG (in thousands)
As can be seen, the -90,000 retro adjustment is the largest of the Trump era (not shown are the first three months in 2019, of 7,000, 13,000, and -7,000). The mean retro adjustment to NPEG is +9,500 jobs, and the higher the annual job growth, the greater the retroactive adjustments in the positive direction. The standard deviation is 24,000 jobs. (Note that these two statistics are computed excluding the -90,000 number, since we believe it to be manipulated.) But the analysis would still hold if it was included.
Previously, the two largest retro adjustments in the Trump era occurred for August, 2018 (+69,000) and September, 2017 (+51,000). The largest negative adjustment was -37,000 in May, 2017. Also note that in the high job growth year of 2018, there were only two other negative NPEG adjustments, for July (-10,000) and September (-16,000).
So the -90,000 adjustment, which we assert that the BLS executed to cover up their tracks for the Trump-friendly 312,000 December NPEG, and set up their subsequent 304,000 January number for Trump’s rescheduled SOU, is quite extreme from the statistical significance point of view. If we use the mean of a +9,500 retroactive job adjustment, and a standard deviation of 24,000, then the -90,000 adjustment is almost four standard deviations from the mean.
This equates to a 1 in 1,000 chance that this number is real and not manipulated, given the standard statistical significance tests (on the data derived from the Trump era). Now, to be fair to the BLS, their own estimate of the confidence interval in the Establishment survey is as follows:
“For example, the confidence interval for the monthly change in total nonfarm employment from the establishment survey is on the order of plus or minus 115,000. Suppose the estimate of nonfarm employment increases by 50,000 from one month to the next. The 90-percent confidence interval on the monthly change would range from -65,000 to +165,000 (50,000 +/- 115,000). These figures do not mean that the sample results are off by these magnitudes, but rather that there is about a 90-percent chance that the true over-the month change lies within this interval.”
This is a related, but slightly different statistic than the “first month’s retro adjustment” that we derived our probability estimate for. And their application of “true over-the-month change” implies that they are NOT using their own internal retroactively adjusted employment growth sample to derive this estimate, but rather, something they call “true” employment growth, which could only be computed using the data from the entire population of establishments.
Averting the Jobs Report Apocalypse Now that we have cast some doubt on the validity of the December 2018 NPEG and the statistically improbable BLS retro adjustment for it the following month, what did the BLS have to say about the Federal shutdown and its expected impact on NPEG?
Even though the federal shutdown began on December 22, 2018, the December jobs report does not mention it. There is no problem with this omission, as the 12th day of the month is the date used to officially count the NPEG, so it was too late to include its impact, and the BLS is following its regular sampling methodology.
But just a month later, on January 12, 2019, 380,000 furloughed federal workers (sent home, and not working without pay), and an estimated 1,200,000 federal contractors were without paychecks, and according to the methodology prescribed by the BLS, should be counted as unemployed. That was about 1% of the total labor force.
The jobs report was going to be a disaster for January. Jobs growth should be negative and the unemployment rate should be close to 5%. It was the apocalypse. So what did the BLS report for January?
As previously mentioned, the BLS found not a decrease, but an increase of 304,000 jobs. How did that happen? Let’s talk about their handling of the Establishment survey first. Here is the BLS description of the government shutdown’s impact on the establishment survey.
“There were no discernible impacts of the partial federal government shutdown on the estimates of employment, hours, and earnings from the establishment survey.”
Say what? What did they say? How did they get out of this one? Let's find out. On page 5 of the jobs report for January, 2019, the BLS explains the treatment of the federal shutdown. First, here is how the BLS handled the Household survey:
“Workers who indicated that they were not working during the entire survey reference week and expected to be recalled to their jobs should be classified as unemployed on temporary layoff. In January 2019, there was an increase in the number of federal workers who were classified as unemployed on temporary layoff. However, there also was an increase in the number of federal workers who were classified as employed but absent from work. BLS analysis of the underlying data indicates that this group included federal workers affected by the shutdown who also should have been classified as unemployed on temporary layoff. Such a misclassification is an example of nonsampling error and can occur when respondents misunderstand questions or interviewers record answers incorrectly. If the federal workers who were recorded as employed but absent from work had been classified as unemployed on temporary layoff, the overall unemployment rate would have been slightly higher than reported. However, according to usual practice, the data from the household survey are accepted as recorded. To maintain data integrity, no ad hoc actions are taken to reassign survey responses.”
All right, so it looks like the BLS is obviously manipulating the unemployment rate right in our faces. Somehow, a lot of these federal workers were misclassified as “employed but absent from work” when they should have been categorized as “unemployed on temporary layoff”. Damn census takers. It’s so hard to find good help these days.
Conspiracy buffs, be patient But before the conspiracy buffs make too much of this, we might add that there was a federal shutdown in October, 2013, under Obama, with a similar problem of misclassifying laid off federal workers. So conspiracy buffs, be patient. There is plenty more to show you about the BLS workaround of the negative jobs impact of the federal shutdown.
Since they had a significant problem in 2013 with misclassifying the unemployed federal workers as employed, one would think this would be corrected for the 2018 shutdown. That the BLS should be expecting this to happen again, and they would take measures to properly address the problem. Keep in mind that the BLS is very aware of the 2013 problem, and cite it in their 2019 report.
So did they warn the census takers prior to their interviews? Or make backend adjustments for incorrect data? Let’s take a look at two data points collected by both the Household surveys for January 2019 and October 2013 side by side, and see how they compare.
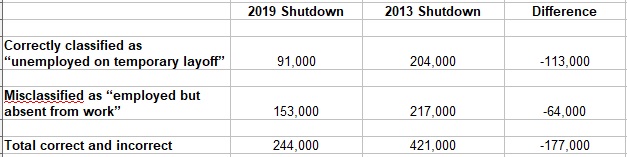
Census of Federal Employees on Furlough and Not Working
So the BLS only estimated that 244,000 Federal workers were impacted in 2019, a 177,000 decrease from the number they counted in 2013. And further, 63% of those furloughed workers were misclassified in 2019, compared to 52% in 2013. So the rate of misclassification actually was worse in 2019, despite the BLS being fully aware of the problem. And further, in 2013, the BLS was laid off during the shutdown, and only had half a month to complete their report. But somehow the BLS was exempt from furlough in 2019, and worked the full month, which is an interesting topic in itself.
Now, estimates of the actual number of furloughed workers sent home were sketchy for both 2019 and 2013. Note that critical federal workers called back into work are not included in these estimates, as they are considered employed. There were about 400,000 of such employees. But for the workers sent home, one estimate (from the senate Democrats and reported on CNN) pegged that number to be 380,000. Now the BLS has some interesting verbiage about the magnitude of the 2019 federal shutdown.
“According to public sources, about 800,000 federal employees were affected by the lapse in appropriations, including approximately 500,000 federal employees who worked without pay during the lapse in appropriations and roughly 300,000 who did not work during the shutdown.”
Note that the BLS uses “about”, “approximately”, and “roughly” to describe the impact, “according to public sources”, which they don’t identify. CNN reported 380,000, but admittedly, this number could be anything, as the timing of the furloughs and subsequent employee recalls made this number a moving target as the shutdown progressed.
However, the exact number could easily be computed with access to Federal payroll activity reports for Pay Period 01 in 2019, which presumably the BLS would have easy access to. But we suspect the BLS uses the “roughly 300,000 estimate”, “according to public sources”, as it furthers the purpose of under reporting the full impact of the federal shutdown on the jobs report.
Without the Trump administration breathing down their necks, the BLS behavior during the 2013, while arguably having its own set of issues, seems to be more honest with the true impact of the federal shutdown. That report showed an overall increase in the “number who reported being on temporary layoff increased by 448,000”.
In January 2019, “the number who reported being on temporary layoff increased by 175,000”. The difference between 2013 and 2019 is 273,000 laid off federal workers. That's quite a difference from what should be measures of the same underlying statistic. This number, of course, contains both federal employees and others, and we include this only to demonstrate another statistic that points to BLS book cooking in January 2019.
But while we believe the BLS was actively doing their best to hide the impact of the federal shutdown in the Household survey, the Establishment survey has a very strange issue for January, 2019.
Only make ad hoc corrections when they benefit Trump Let’s look at the BLS explanation as to why they did not make an ad hoc correction to the federal workers that were misclassified as “employed” during the shutdown.
“If the federal workers who were recorded as employed but absent from work had been classified as unemployed on temporary layoff, the overall unemployment rate would have been slightly higher than reported. However, according to usual practice, the data from the household survey are accepted as recorded. To maintain data integrity, no ad hoc actions are taken to reassign survey responses.”
So even though the BLS was well aware that they had an error, and that it artificially made the unemployment rate look better, they didn’t make an ad hoc correction. Okay, this is in line with their same behavior in 2013, when they also made no ad hoc correction for this very same problem.
But remember the 12th day of the month as being the reference date for computing the NPEG and HEG numbers? This was a longstanding practice with the BLS to base its employment calculations on pay periods that included the 12th day of the month. Whatever your employment situation was in the pay period that included the 12th, that was how you were counted in the Establishment survey. Except for January, 2019, where they made an ad hoc change to pump up the numbers. Let’s see how they did it.
Back in October, 2013, with the shutdown that lasted from October 1st to October 16th, the 12th of the month fell into Federal Pay Period 20, which was from October 6th to October 19th. Since the shutdown ended on October 17th, the Federal employees were employed as of the end of the pay period, and were counted as employed in the jobs report. I am sure the BLS breathed a sigh of relief at that time, as their accounting processes didn’t need to be creative to hide the Federal shutdown in the Establishment report. They simply followed their standard practice in counting employment.
But in January, 2019, Trump was president. And the BLS was nervous. Standard? What standard? They made an ad hoc adjustment and conveniently left out the words “ad hoc”. Why? Because the 12th fell into Federal Pay Period 01, which was from January 6th to January 19th. And the Federal shutdown didn’t end until January 25th. So they were unemployed according to their official and longstanding methodology of accounting.
And that would have destroyed the NPEG for January. Maybe even make it negative, because 300,000+ Federal workers should have been counted as unemployed that were counted as employed. Do you think Trump wanted to show up at the SOU on February 5th having to face down a negative employment growth number that he caused because of his wall?
Now, let’s take a closer look at the BLS standard verbiage found in every jobs report for counting employment in the Establishment survey.
“In the establishment survey, businesses and government agencies report the number of people on payrolls during the pay period that includes the 12th of the month. Individuals who work or receive pay for any part of the pay period are defined as employed.”
That’s that. Pretty clear. Can’t argue with that. But wait. For the January, 2019 jobs report, they added something they had never added before, not even for the 2013 shutdown:
“Federal employees on furlough during the partial federal government shutdown were considered employed in the establishment survey because they worked or received pay (or will receive pay) for the pay period that included the 12th of the month.”
So the BLS did make an ad hoc exception to their normal accounting processes, and covering it by carefully slipping in the verbiage “or will receive pay”, which is contrary to their established "pay period" method for defining employment. This was the first time this verbiage appeared in a BLS employment report.
So they averted the disastrous NPEG number, and five days later, Trump’s SOU speech bragging about the economy was saved.
That some fancy dancing, BLS. No wonder you weren’t laid off for this shutdown, but you were laid off for 2013. One might ask, why would the BLS be considered an essential government service? The answer might be political. If you were Trump, would you lay them off?
What happened to the Federal contractors that were laid off? As sizable as the Federal employee layoff was, it wasn’t as nearly as big as the estimated 1.2 million federal contractors that weren’t getting back pay, and couldn’t be swept under the rug with the same ad hoc accounting adjustment the BLS made for Federal employees. That’s about 0.7% of the entire labor force, and would have jumped the unemployment rate towards 5%. So BLS, can you make that disappear too?
Poof. Gone. So where did they go? That’s a lot to miss, even for the BLS, and even with Trump ready to pounce on them for an embarrassing jobs number. They don’t say anything about the federal contractors in the main jobs report, but in their addendum, they mention them several times.“Federal contractors, as well as other workers, who did not work or receive pay during the shutdown were not counted among the employed….It is likely that some private industries were affected by the shutdown; however, BLS is not able to identify or quantify the impacts.”
And then the BLS gives us a hint as to where some of them went:
“One possible indication of a shutdown effect can be seen in the household survey estimate of people who are employed part time for economic reasons. The number of these workers—also referred to as involuntary part-time workers—increased by about one-half million in January to 5.1 million (on a seasonally adjusted basis). Nearly all of this increase was in the private sector and may reflect the shutdown, as hours were reduced because of slack work or business conditions.”
Now for the Household survey, the HEG drops 251,000 in January, and 91,000 of that are correctly classified as Federal layoffs. We could therefore make the assumption that the difference, 160,000, included federal contractors. This would account for 700,000 of the missing 1.2 million laid off contractors, presumably leaving 500,000 unaccounted for. But again, these numbers are provisional, and no definitive study now exists (that we know of) that provides a concensus number.
But also note that the subsequent decrease in “employed part time for economic reasons” declined 837,000 in the next month (February 2019), to which the BLS says:“[t]his decline follows a sharp increase in January that may have resulted from the partial federal government shutdown.”
Again throwing more suspicion on the BLS accounting of the federal shutdown, there were about 300,000 more "employed part time for economic reasons" that came back into full-time employment after the shutdown than left during the shutdown. Therefore, the February accounting of the impact of the federal shutdown is a substantially better fit than the January accounting. Also note that the Establishment survey for January not only didn’t see any loss of federal employment, they reported a 1,000 gain. And thus the magical brilliance of BLS accounting. They made a federal shutdown disappear.
But that is not to say that the October 2013 report didn’t have its own nuances. It did, and it didn’t specifically address the federal contractor issue.
Chronology of Events As we have shown, the behavior of the BLS and Census Bureau were a godsend to Trump. This should have been a disastrous January 2019 report. Instead of negative jobs growth and an unemployment rate near 5%, Trump got a 304,000 job growth and a 4% unemployment rate. Thank you, BLS. You saved Trump from a very embarrassing jobs report. Now let’s review the chronology of how this all went down.
December 22, 2018 - Federal shutdown begins over funding of Trump’s wall. Note that the BLS was not laid off under Trump, as they were during the 2013 shutdown, as they were not deemed as being essential services in 2013.
January 4, 2019 - BLS jobs report released, showing 312,000 job growth and a 3.9% unemployment rate. A great number for Trump to reference during his State of the Union address, scheduled for January 29.
January 23, 2019 - January 29 SOU postponed per Nancy Pelosi due to Federal shutdown.
February 1, 2019 - BLS jobs report released, and retroactively corrects the previous jobs report by -90,000 jobs. The December 312,000 job growth was revised downward to 222,000. This is almost 4 standard deviations from the mean. Then the report goes on to say that job growth for January is 304,000 and the unemployment rate ticked up to 4%. Makes no adjustment for incorrectly recorded surveys that benefit Trump. Makes an ad hoc adjustment to modify the 12th day of the month pay period cut off, which again benefits Trump, and allows for the high job growth number.
February 5, 2019 - Trump gives his SOU address and cites that job growth number. Says: “On Friday, it was announced that we added another 304,000 jobs last month alone -- almost double what was expected. An economic miracle is taking place in the United States -- and the only thing that can stop it are foolish wars, politics, or ridiculous partisan investigations.”
Did you all understand? Investigate Trump and there won’t be anymore jobs.
March 8, 2019 - The BLS only reports a 20,000 NPEG for February, 2019. After two successive months of cracking 300,000 job growth, the BLS is settling its books. No more blatant creative accounting for Trump. They have to get their year to date job growth numbers in line, so they take it out on the February report. The 20,000 job growth is the lowest since the passage of the tax plan and tariffs. But the unemployment rate ticked lower, dropping to 3.8% after the shutdown.
March 13, 2019 - William Beach, an economist and fellow in the Heritage Foundation, originally nominated as Commissioner of the BLS on October 26, 2017, was confirmed by the Senate, in a 55-44 vote. He assumes role on March 28. William Wiatrowski assumes his old role as Deputy Commissioner.
May 3, 2019 - First report reflecting Beach’s full month of control of the BLS comes out for April. Unemployment rate hits its lowest mark under Trump, at 3.6%. However, the Household survey reports 300,000 less total jobs in April than it reported December, 2018.
So how did the BLS do it? Manipulating data in large institutions to benefit the leadership of those institutions is the rule to which there are few exceptions, if any. This is true in business and in government. There has always been a funniness to the BLS data that was present well before Trump. Part of that funniness is inherent in the nature of sampling. Part of it are methodological errors. And part of it is deliberate bias, as came to a head in the January report.
There are dozens of points in the acquisition and processing of the BLS data where both bias and methodological errors can be introduced. And based on the data the BLS provides the public, these can be hard or impossible to detect.
The BLS freely admitted to one of those methodological errors, which was the misclassification of furloughed Federal employees during the census process. And census taking is one of those points where the numbers can be cooked. As previously noted, the GOP accused employees in the Census Bureau of deliberately skewing their survey results to pump up the numbers for Obama.
And given the fact that there was a well known misclassification problem in 2013, it is interesting to note that the error was not corrected in 2019. The Census Bureau and BLS had ample warning. We do not know if there was any willful intent along the chain of command that is responsible for data quality, but the error rate was worse in 2019.
But we don’t believe that deliberate misclassification during the census process is likely to be a common vehicle for manipulating the jobs reports. There are easier ways that require less participants, much easier to execute, and much easier to conceal. This involves the “data modeling” algorithms that sit on top of the data and that can move the jobs numbers in any direction they want.
For example, “new business”. In the words of the BLS:“monthly establishment survey estimates include an adjustment to account for the net employment change generated by business births and deaths. The adjustment comes from an econometric model that forecasts the monthly net jobs impact of business births and deaths based on the actual past values of the net impact that can be observed with a lag from the Quarterly Census of Employment and Wages. The establishment survey uses modeling rather than sampling for this purpose because the survey is not immediately able to bring new businesses into the sample. There is an unavoidable lag between the birth of a new firm and its appearance on the sampling frame and availability for selection. BLS adds new businesses to the survey twice a year.”
So adjusting the “model” adjusts the jobs numbers. And the above verbiage gives the appearance that the jobs reports have a bias based on using lagged data to model current business conditions. But since we have no idea what that econometric model looks like, this is only an educated guess. But this is something the new commissioner, William Beach, would know quite a bit about.
Note that the Establishment survey applies two successive months of retroactive adjustments after the initial report. So what? The trained eye sees opportunity in such a situation, especially if there is a correlation between jobs growth and establishment reporting. For example, let’s suppose that smaller businesses are growing jobs faster than big businesses. The BLS could then prioritize the counting of small businesses ahead of big, and pump the current jobs report, that will be subsequently reduced when the big businesses are counted, and cause a retroactive downward adjustment the following month. Since no one looks at the retroactive adjustments anyway, it’s like taking candy from a baby.
And some variation of this approach might be how the BLS executed the original 312,000 jobs growth report in December. Or, they could have toyed with the “seasonal adjustment” factors. Since December is a month of large scale temporary hiring which is normally adjusted downward by the BLS, any change to these adjustment factors changes the jobs growth.
But when Trump’s January State of the Union address was postponed, let's just imagine what was going on in the secret meetings among the leaders of the BLS. It might have went like this:BLS leader X: “Damn, the SOU was canceled. That damn Trump has been on our asses to give him a good job number for his SOU, and we did. And now the fuckin’ thing is canceled by his fuckin’ wall.”
BLS leader Y: “We’ll have to retro it out and pump up January.”
BLS leader X: “Two months over 300,000? In a row? It’s going to look suspicious.”
BLS leader Y: “Who cares? The dumb Trumpers will believe anything that liar says, and the libtards never question these reports.”
BLS leader X: “Okay, let’s retro out December by 130,000 and pump up January to 330,000.”
BLS leader Y: “Can’t do that. The 90% confidence interval is 115,000. Our average retro under this idiot is about 10,000. Let’s go with -90,000. That makes the total variance 100,000, and keeps us under 115,000. And 330,000 is too big, we’ll have to make another huge retro to clean up year to date. So let’s pick something just over 300,000.”
BLS leader X: “How about 310,000?”
BLS leader Y: “Sounds made up. Let’s do 304,000. And let’s not retro this one, that will really look suspicious after what we did in January. Let’s take it out of February. We’ll make that 20,000.”
BLS leader X: “Okay, but Trump is not going to like it. Let’s bounce down the unemployment rate to 3.8 to keep him off our backs.”
BLS leader Y: “Don’t worry about it. Trump’s not going to do anything to us. They've tabled Beach's nomination for over a year now, so we don't have to worry about having that Republican operative from the Heritage foundation come in and cook the numbers. Besides, we just gave him two 300,000 plus months in a row. When has Trump ever backstabbed someone that’s helped him out?”
The February BLS report with 20,000 jobs was published on March 8.
Just 5 days later, William Beach, an economist and fellow in the Heritage Foundation, originally nominated as Commissioner of the BLS on October 26, 2017, was finally confirmed by the Senate on March 13, 2019.
Curtis Laforge, May 2019