Part 2: The "Inexplicable" Jobs Write Down of 2019
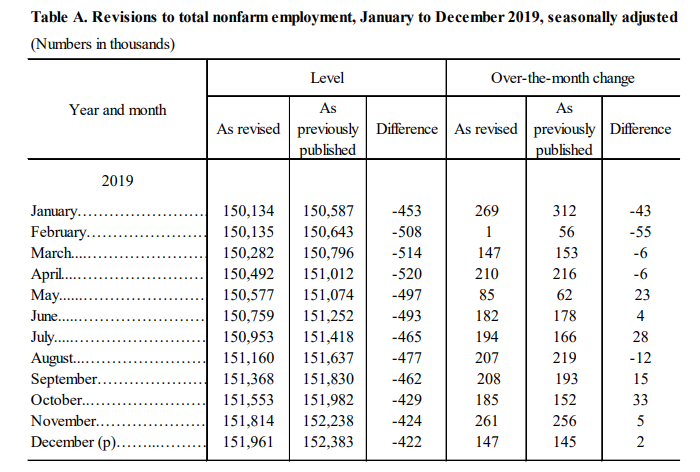
Table A: The BLS quietly wrote off 514,000 jobs in 2019 due to over counting, and the media did not say a word.
The BLS is currently ōinvestigatingö the cause.
In our previous article, we documented what we believed was a deliberate deception in the jobs report, as orchestrated by the Bureau of Labor Statistics (BLS). The BLS currently reports to the Secretary of Labor, Eugene Scalia.
Yes, that Scalia. Eugene is the son of the late Supreme Court justice Antonin Scalia. Not only that, Eugene also served as the special assistant to the Attorney General, William Barr, in 1992. And his law firm represented George W. Bush in Bush v. Gore.
But Scalia is just a link in the long chain of cronyism involving economic reporting for the Trump administration. The commissioner of the Bureau of Labor Statistics, William Beach, was previously the director of the Heritage FoundationÆs data analysis department, and had a very interesting pathway to final control over the BLS. William Beach was first nominated for the job on October 26, 2017.
But his vote was tabled for sixteen months, while William Wiatrowski, a registered Republican, served as acting commissioner. But this long delay of his confirmation would come to an abrupt end. On March 8, 2019, the BLS released a jobs report with only 20,000 new jobs, a low number and the lowest of the Trump administration. And just five days later, Wiatrowski was replaced, as the senate finally voted on Beach, who had been waiting in the wings for sixteen months since his nomination.
Pumping the job numbers
Coincidence? As we have witnessed many times in the Trump administration, people that make the president look bad are not long for their jobs. And they all know it. This is the fundamental principle of TrumpÆs management style, and especially applies to economic reporting, since Trump understands that economic success is a key factor in his re-election. Would Trump put pressure on the BLS to pump up the jobs data for his own selfish purposes? Of course he would.
But the BLS is not the only player in the jobs report. The Census Bureau (CB), which reports to the Secretary of Labor, Wilbur Ross, conducts interviews for the ōHouseholdö survey, which ultimately are used to determine the unemployment rate. This is from a sample of ōabout 60,000ö households provided by the Census Bureau.
Obviously, controlling the sampling method controls the final outcomes. Do you want the unemployment rate to go down? There are many ways to do it. Just overweight your sample in counties with already low unemployment rates. Save for a rare inspector general or congressional inquiry, there are no external checks or audits on the conduct of either the Census Bureau or the BLS in the construction of the jobs report. It is easily steered without consequence. And the ways to do it are numerous and impossible to detect based on the information provided by the CB and BLS to the general public.
Pressure on the BLS: The 2019 State of the Union Address
But occasionally, their many published reports expose interesting issues with their methods. Such was the case with the January 2019 report, which we dissected at length in a previous article. To briefly sum up, the BLS was engaged in pumping up the jobs number right before the 2019 State of the Union Address. And not only once, but twice, since it was postponed by the Federal shutdown.
The Federal government shutdown began December 22, 2018, over the funding of TrumpÆs wall. Trump was to give his SOTU address on January 29, 2019, and earlier that month, on January 4th, the BLS released its job numbers for December, 2018. They reported a whopping 312,000 new jobs created.
While there was nothing immediately indicating that the BLS exaggerated this number, things would get curiouser with their subsequent behavior. Keep in mind that Trump is getting ready for the January 29 SOTU at the time of its release, January 4th. And while Trump was going to use this big jobs number as a talking point for his upcoming SOTU, there was a slight problem. The government was shut down. Over his wall.
And furloughed Federal workers are not counted as employed. Neither are the employees of Federal contractors. And this number could have been as large as two million jobs lost as a result of the Federal shutdown. And all because of TrumpÆs wall. But still, if Trump could give his SOTU on schedule, he could still ride in on his white horse about the economy.
But TrumpÆs SOTU was postponed by Nancy Pelosi until February 5th, so Trump would have to face off with the January 2019 jobs report, due on February 1st, which might be reporting an epically devastating two million job loss.
How do you hide the jobs impact of a Federal shutdown?
Even though the Federal shutdown officially ended January 25th, the accounting methodology used by the BLS only counted you as having a job if you were employed on the 12th day of the month. And that method would have excluded as many as two million Federal employees and contractors that were impacted by the shutdown. Trump and the BLS were facing down the worst jobs report in history. And right before the SOTU.
And thatÆs when the BLS ramped up their creative accounting. Not only did they make a potential 2,000,000 job loss disappear, they reported a stunning 304,000 jobs created, just four days before TrumpÆs rescheduled SOTU. The BLS used several accounting tactics to accomplish this, as we previously described in detail in this article.
To briefly summarize, the first tactic was to change the criteria of employment from being employed on the 12th day of the month. This was a longstanding procedure that they removed specifically for January 2019, restoring this criteria the following month. While that could make the furloughed Federal workers go away quickly, the problem was now with the Federal contractors, which were about 1.2 million people. And for some reason, the BLS couldnÆt find them, as they mentioned it in their report.
ōFederal contractors, as well as other workers, who did not work or receive pay during the shutdown were not counted among the employedģ.It is likely that some private industries were affected by the shutdown; however, BLS is not able to identify or quantify the impacts.öThatÆs a lot of people to miss when counting employment, even for the BLS. But letÆs back up one month, to December 2018, which produced the large 312,000 new jobs that Trump was going to reference in his originally scheduled SOTU. There is a data point that highlights the funniness of this high jobs number.
The BLS retroactively adjusts job counts for a given month in each of the two months that follow it. And the fix that the BLS applied to the 312,000 new jobs was a whopper. They retroactively reduced it by 90,000, an unprecedented correction in the Trump era.
This retroactive reduction of 90,000 was four standard deviations from their average adjustment. Statistically, this is highly improbable. If only the BLS knew that the SOTU would be postponed a month, they could have avoided overreporting new jobs for December, 2018.
While the BLS behavior around the December 2018 report was suspicious, it was nothing compared to January 2019, which should have included the Federal shutdownÆs impact on Federal workers and contractors. But what should have been a disastrous report was magically transformed into 304,000 new jobs, which Trump immediately referenced in his SOTU address, delivered four days later, on February 5th.
ōOn Friday, it was announced that we added another 304,000 jobs last month alone -- almost double what was expected. An economic miracle is taking place in the United States -- and the only thing that can stop it are foolish wars, politics, or ridiculous partisan investigations.ö
Trump got his big jobs number, and was taking full credit for it. But all was not wine and roses for the BLS. This was an immediate problem, and one that could blow the lid off their creative jobs reporting. And that problem was something the BLS called the ōbenchmark revisionö. To understand the ōbenchmark revisionö and the problem the BLS was facing with its generous jobs reports for Trump, letÆs first understand how the monthly jobs numbers are derived.
One survey is harder to fix than the other
There are actually two different sample surveys reported by the BLS each month, the Household survey and the Establishment survey. The Household survey, according to the BLS,
ōis a sample survey of about 60,000 eligible households conducted by the U.S. Census Bureau for the U.S. Bureau of Labor Statistics (BLS).öSo in other words, Wilbur Ross is ultimately responsible for the selection and interviewing of the ōabout 60,000 eligible householdsö that they survey. And their definition of ōeligibleö is not included in the monthly jobs reports. So what could go wrong? Who would accuse the Census Bureau of cooking the books? Who would be so conspiratorially minded to make such a ridiculous accusation?
Donald Trump. Trump had previously criticized the Census Bureau for cooking the books for Obama right before the 2012 election. So Trump believes that census workers can steer the unemployment rate to favor a president. Gee, I wonder if heÆs had private conversations with Wilbur Ross about that? Would Trump do anything like that? Would he put pressure on someone to be creative with information just to win an election?
But back to the Household survey. The BLS says that the employment number reported by the Household survey is ōstatistically significantö at about plus or minus 500,000 jobs. So the unemployment rate, presumed to be the authoritative standard of domestic economic conditions, is really ōsomewhere around thereö.
But the BLS is not worried about the Household survey. Plus or minus 500,000 jobs gives them a large statistical cushion for making credible benchmark adjustments. It would look very suspicious if they had to make a 2,000,000 job revision, after claiming they are within 500,000 jobs 90% of the time.
But the Establishment survey is a different animal, and large variances are much more difficult to explain. According to the BLS, it is ōstatistically significantö at plus or minus 110,000 jobs, and they have much less room for error. A 514,000 correction is way over their standard error for their survey. And statistically, highly improbable.
So why is 514,000 such a suspiciously high error? LetÆs look under the covers of the Establishment report, as explained to us by the BLS.
The ōBLS collects these data each month from the payroll records of a sample of nonagricultural business establishments. Each month the [Current Employment Situation] program surveys about 145,000 businesses and government agencies, representing approximately 697,000 individual worksites, in order to provide detailed industry data on employment, hours, and earnings of workers on nonfarm payrolls. The active sample includes approximately one-third of all nonfarm payroll jobs.öSo, thatÆs quite a survey. ItÆs one-third of nonfarm payroll jobs. With such a large sample, they should provide an accurate estimate. And indeed, on a base of about 150,000,000 jobs, the BLS claims that the standard error of the nonfarm payroll jobs, as of this writing, is 66,206 jobs. That equates to only about 0.05% of the total job count, indicating an extraordinarily close correlation of their monthly estimate to the ōtrueö job count.
The Grim Reaper: the "annual benchmark revision"
And if the BLS did indeed pump up the numbers for Trump with its December 2018 and January 2019 reports, they had to feel a little nervous. And that nervousness came in the form of their ōannual benchmark revisionö, that was just around the corner.
So what is this ōannual benchmark revisionö, and why was the BLS so concerned about it? After all, canÆt they just continue on with their monthly survey samples like nothing happened? Why did they apply such a large retro reduction for December 2018, and why was the February 2019 jobs growth the lowest of the Trump era?
The ōannual benchmark revisionö is based on employment data that is almost 100% of actual national employment. In other words, it was the proverbial ōtrueö jobs count. And this revision, according to the BLS, is compiled as thus:
ōAll employers covered by UI [unemployment insurance] laws are required to report employment and wage information to the appropriate state Unemployment Insurance agency four times per year. Approximately 97 percent of private and total nonfarm employment within the scope of the establishment survey is covered by UI. The UI data are obtained and edited by each state's Labor Market Information (LMI) agency, and are tabulated and published through the BLS Quarterly Census of Employment and Wages (QCEW) program. A benchmark for the remaining 3 percent is constructed from alternate sources, primarily records from the Railroad Retirement Board (RRB) and County Business Patterns (CBP).ö
So the BLS has a near universe of nonfarm payroll employment data, and makes an annual revision, using March as the month it applies the correction. And why does the BLS revise the employment data? WeÆll let them answer.
ō...annual benchmarks are constructed in order to realign the sample-based employment totals for March of each year with the Unemployment Insurance (UI) based population countsö.So the BLS revises the job counts published in their monthly Establishment survey with counts they get from the Unemployment Insurance systems, as almost all employers are required to report their payroll information. 97% of employers do this, and the other 3% are handled via interfaces with other systems.
This is also the universe of payroll employment in which the BLS bases its ōstandard errorö for its Establishment survey. And that standard error, as of this writing, is 66,206 jobs. And this small number makes it easy to see why the BLS was actively working to reduce the impact of the suspicious back-to-back 300,000 new jobs they produced in the wake of TrumpÆs SOTU.
The 90,000 retro write down for December and the low 20,000 February new job count were both suspicious numbers, the latter of which ended in Trump replacing the acting commissioner of the BLS, William Wiatrowski, just five days after its publication.
But even still, these suspicious numbers werenÆt enough to clean up the generous job accounting that the BLS was giving to Trump. In their January 2020 report, they announced the results of their ōbenchmark revisionö, and it was big. LetÆs take a look at Table A at the top of this page, which shows the BLS 2019 job count revisions by month, as the BLS published in the January 2020 jobs report.
The Great Jobs Write off of 2019
The first column in Table A is the revised total nonfarm payroll job count. This is AFTER their benchmark revision. The second column was what the BLS reported using their ōsampling methodö. And the third column is the difference.
If we look at March, 2019, we can see the BLS wrote off 514,000 jobs (these are seasonally adjusted). In fact, March was the benchmark month, and all the other months, from April 2018 through December 2019 are adjusted down using this single March data point.
Now we will get to this unusual accounting methodology shortly, but first letÆs focus on the 514,000 job write down. That is 7.76 times the posted standard error of 66,206, as of this writing. And a 514,000 error is highly improbable. Given ordinary statistical sampling and the standard error of 66,206 jobs, the probability of having to write off 514,000 jobs from the jobs report is less than 1 in 1,000.
Five years?
So something methodologically was wrong with the monthly job reports for 2018-2019, which suspiciously favored Trump to the tune of 514,000 new jobs. After all, Trump wouldnÆt put pressure on someone that worked for him to improve his chances at re-election, would he? But before we get to some more suspicious data which points to BLS manipulation of the job counts, letÆs delve into this ōbenchmarkingö process which seems to be counter intuitive.
The first curiosity with their ōbenchmarkingö process is that it is based on a single month. But the BLS has UI counts for each of four quarters. Why donÆt they benchmark each quarter end? Why not benchmark March, June, September, and December? Obviously, time lags make it more difficult to accurately benchmark December. But the BLS only uses March, and ōadjustsö the other months based on this March revision. And the number of months they revise is surprising.
ōThe benchmark process results in revisions to not seasonally adjusted data from April 2018 forward. BLS revised seasonally adjusted data from January 2015 forward. In addition, both seasonally adjusted and unadjusted data for some series incorporate other revisions prior to 2015.öSo, according to this statement, they can revise job counts back five years. Five years? Why would they do that? After all, they are now revising data that was previously benchmarked with actual payroll data. According to this, they are even modifying previously benchmarked March data points, which were the actual job counts for that month. Why would they do that?
We suspect this strange BLS accounting policy sustains previously reported annual job growth. For example, if we remove 500,000 jobs from 2019, then job growth for 2019 is 500,000 less than previously reported. But if we also remove 500,000 jobs from the previous December 2018, we keep our previously reported 2019 annual job growth intact. But now weÆve decreased the previous yearÆs job growth, and caused the same issue with the previous year. So letÆs continue to subtract 500,000 jobs from two years ago, and so on. While this BLS procedure defies intuition and more accurate alternatives, it does retain the integrity of previously published annual job growth, which is the most political number in the Establishment survey.
Replacing good data with bad
So what if we made an error this year? WeÆre going to propagate that error retroactively, even if we have to introduce error into previously reported months. In fact, the BLS admits to this tactic of ōsmoothingö out errors in their originally published numbers. Here is how they phrase it:
ōIn order to create a continuous time series between the new March benchmark level and historical sample-based data from the prior March benchmark level, employment estimates for the months between the most recent March benchmark and the previous year's benchmark are adjusted using a linear æwedge-backÆ procedure, which assumes that the total estimation error accumulated at a steady rate since the last benchmark.öNow, the above statement, while seemingly innocuous, is a bit troubling. First, this technique propagates errors into months that might have been correct to begin with. And second, it does not differentiate seasonally adjusted from non-seasonally adjusted data, which in other text provided by the BLS, have different retroactive adjustment periods.
Pick a standard error - any standard error
But ambiguity abounds in the verbiage strewn through the myriad of BLS technical documents. And this ambiguity is also present in their own definition of the ōstandard errorö of their monthly payroll sample. And this one is really strange. LetÆs parse their own words.
ōThe total annual revision is the difference between the benchmark level for a given March and the published March sample-based employment estimate. The overall accuracy of the establishment survey is usually gauged by the size of the benchmark revision, which is often regarded as a proxy for total survey error.öQuite a remarkable statement. And as evasive as it could be. The difference between benchmark and their monthly sample is ōoftenö regarded as a ōproxyö. Okay, BLS, ōoftenö does not equal ōalwaysö, at least in the normal application of the English language. So in those cases where itÆs not used, what does the BLS use?
This arbitrariness of this definition appears to be language specifically designed to give the BLS the flexibility to pick a standard error and confidence interval to their liking. And to highlight this accusation, we only have to look at their December 2019 report and compare it to their January 2020 report.
For December, 2019, the BLS says: ōthe confidence interval for the monthly change in total nonfarm employment from the establishment survey is on the order of plus or minus 110,000.ö This is before the 514,000 error was included in their supposed derivation of standard error.
For January, 2020, after supposedly incorporating the 514,000 error in their new derivation of standard error, the BLS says: ōthe confidence interval for the monthly change in total nonfarm employment from the establishment survey is on the order of plus or minus 110,000.öWhat? After applying the 514,000 error, which is a ōproxy for total survey errorö, the confidence interval doesnÆt change? How is that possible? It should go up. In fact, just one year earlier, in January, 2019, it was 115,000. And a year later, after correcting for the large error, it went down? What kind of math is this?
The BLS might be deceptive, but they ainÆt stupid. Their wording about standard error is deliberately vague. And this allows them to ōselectö a standard error, which they could obviously back into using a variety of other assumptions besides the standard mathematical process of computing it. This follows the general tendency of BLS reporting: the closer one looks at the specifics, the funnier they seem.
Whatever you do, hold onto job growth
But letÆs get back to 2019, and take another look at the above table. After the BLS adjusted March 2019 by -514,000, they also adjusted January through December. DecemberÆs adjustment was -422,000. So why the difference? The BLS gives the following reason:
ōFor the nine months following the March benchmark (also referred to as the post-benchmark period), BLS applies previously derived over-the-month sample changes to the revised March level to get the revised estimates. New net birth-death model forecasts are also calculated and applied during post-benchmark estimation.öSince the BLS very much wants to maintain its previously computed month-to-month jobs growth numbers, the -514,000 is applied to every month from April to December. But it does something else, and that is to apply new net ōbirth-deathö model forecasts on top of that change. Note that these are not human birth-deaths. They are business birth-deaths. The BLS has a persistent issue in its monthly reports, which is in the reporting of new and failed businesses. But once again, weÆll let them explain.
ōThe sample frame is built from Unemployment Insurance (UI) quarterly tax records. These records cover virtually all U.S. employers and include business births, but they only become available for updating the CES sampling frame 7 to 9 months after the reference month.öSo they are retroactively changing their previously published job counts with updated information on new and failed businesses that werenÆt part of their original samples. Okay, we canÆt argue with this. As you see in Table A, for December, they made a 92,000 positive adjustment to the -514,000 write down. (-422 = -514 + 92). So when the BLS finally did receive updated information on new and failed businesses, they adjusted their previously published numbers. And in this case, 7 of the 9 months after March were adjusted up.
How did they do it?
One can easily be cynical of the BLS reports. ItÆs hard not to be. But if indeed the BLS cooked the books to help Trump with his 2019 SOTU, how did they do it? After all, there are so many hidden components in their methodology, that it would be hard, if not impossible, for the general public to detect deliberate manipulation.
For example, they can skew the numbers by skewing the sampling process. For example, the Household survey consists of interviews conducted on ōabout 60,000ö households by the Census Bureau, which is under the control of Wilbur Ross. So any politically-motivated agency, like the Census Bureau, can pick and choose a sample to produce any statistics they want. Do you want to reduce the unemployment rate? Just skew your sample away from households in counties with higher unemployment. You donÆt even have to skew it much.
But the Establishment survey is a different animal. One-third of all establishments are sampled, and that is a large sample size relative to the population. And the benchmark adjustment is nearly 100% of all establishments, so itÆs obviously a better indicator of job growth than the Household survey. So if one was going to steer the results, how could they do it?
The Establishment survey is a mixture of sampling and mathematical modeling. Models are used for seasonal adjustments and proxies to handle such things as the lag in reporting of business births and deaths. And these can be significant adjustments. These would also be areas where a politically motivated BLS could pump up the job count, as it would be difficult for the general public to detect.
But given the large volume of data published by the BLS, there are certain data points that seem a bit funny. Now, we have previously proposed that the BLS doesnÆt even have to do anything to their models or the data to pump up TrumpÆs numbers. All they had to do was modify the timing of how they process the data. The theory being that if you favor the processing of classes of business that have higher growth rates, and delay the processing of classes of business that have lower growth rates until the next month, you can change the results without directly falsifying the data or changing your models.
Now, we have no idea if this indeed was the case for the months of December 2018 and January 2019. But some of the data surrounding the timeliness of reporting for these two months is quite strange, and consistent with the above theory.
And this comes from the ōCES Registry Receipts by Releaseö, found here. Now, what is this strange page of data? Once again, letÆs let the BLS explain it.
ōBLS tracks collection rates for the CES sample on a monthly basis for each release of estimates. Collection rates are defined as the percent of reports received for a monthly estimate compared to the total number of actively-reporting sample units on the sample registry.öFor the Establishment survey, these are the ōcollection ratesö of the payroll data for the one-third sample of establishments used to build their monthly nonfarm payroll job count.
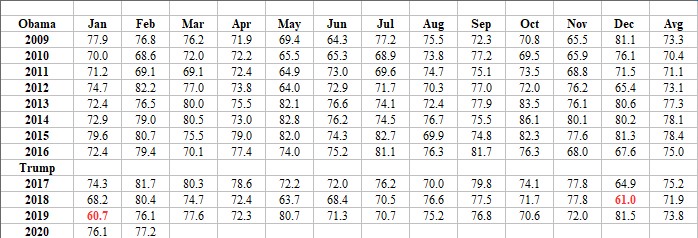
Percentage of reports received compared with actively-reporting sample unitsSo the above spreadsheet shows the payroll reports received as a percentage of their requested sample. For example, for the month of January, 2020, 76.1% of the sample reports requested were received from which the BLS could do its estimate of payroll employment.
Now we included the percentages, by month, for the entirety of the Obama and Trump administrations. And as one can see, the lowest 2 months in the 134 months listed on the above spreadsheet are 60.7%, in January 2019, and 61.0%, in December 2018. The same two months we are accusing the BLS of manipulating.
So the theory is that these two months represent a proactive effort by the BLS to frame the samples to artificially increase job growth. Now one could make the counter argument that the Federal shutdown distorted the results, since it spanned these two months.
But the BLS was still working through the 2018-2019 shutdown. It was not furloughed. LetÆs look at the previous Federal shutdown, which occurred in 2013, during the month of October. The BLS was furloughed during this shutdown. And the percentage received was 83.5%, higher than average. So this is direct evidence that a Federal shutdown does not have an impact on the percentage of payroll reports received.
So this strange anomaly in sample processing just happened to correlate with some very high job counts, a very high retroactive adjustment, and a very low February 2019 job count. A little coincidental, considering the extensive effort the BLS engaged in to hide the impact of the Federal shutdown.
So what are we to make of the behavior of the BLS under Trump? They, perhaps more than any other department that works under Trump, have the most pressure to perform for him. HeÆs already replaced the commissioner once, five days after issuing the lowest job growth report of his term. And finding jobs as economists is not easy.
Trump was the ultimate conspiracy theorist about the BLSÆs behavior during the Obama administration. He even declared that the real unemployment rate was ō42%ö. But he is very quiet about it now. In fact, other than removing Wiatrowski after a bad jobs report, heÆs said almost nothing about it publicly, other than bragging about how great the numbers are.
But privately, he has put a lot of effort to pressure it, especially during periods where he really needs to pump his numbers, like before a SOTU. Or an election. But after the 2019 SOTU incident, in the Establishment report, the BLS was much less generous with their new job growth data from February to December in 2019.
But not the The Household survey, which is easier to manipulate, as the standard error and confidence interval are high, which allows them cover from large annual revisions. And the Household surveyÆs unemployment rate dropped from 4.0% in January 2019 to 3.6% in December. And it was the unemployment rate that became TrumpÆs main talking point, along with the stock market.
November is coming, and this error has us stumped
But the election is coming, and job growth in 2020 is very important to Trump. And the BLS might be back at it with the Establishment survey. The BLS currently has January 2020 job growth at 273,000. And February? Well, thatÆs 273,000 too. Trump appeared to be in for a big year job wise, or he was, until the coronavirus.
WeÆll see how the BLS dances around the economic impact of the coronavirus. They made a Federal shutdown go away. But the coronavirus? Can they make that go away too? After all, if Trump loses in November, William Beach, the ex-Heritage Foundation economist, will be out of a very prestigious job. Just in case, we better keep an eye on their reports heading into November.
And, we are sure, so will the BLS. After all, understanding and correcting problems with their reports, according to them, is very important. In fact, they are stumped about the origin of the large write off of jobs they made to the Establishment survey. Completely stumped.
But take heart, the BLS is checking it out now. They are looking into the problem as we speak. IÆm sure theyÆll find it. In fact, hereÆs what the BLS says about their research on the reasons for the large 514,000 benchmark revision:
ōEarly research and analysis into the components of error has concluded the net birth-death model contributed only a small piece to the total survey error. Although some quarters and industries had larger revisions relative to others, it is less clear that the overall revision can be attributed to a single quarter or industry. The difference in employment growth between the CES estimates and the population in December 2018 and into the first quarter of 2019 requires further investigation. BLS and the CES program will continue to research the possible causes of error within the payroll survey and their impacts on benchmark revisions.ö
You do that, BLS. You do that.
Curtis Laforge, March, 2020
Laforge@apoenian.org