Part 3
The Suspicious Undercounting of Unemployment During the Pandemic
Table 1: Census workers, under Wilbur Ross, made classification errors for three straight months that are artificially reducing the unemployment rate, and can't seem to correct them
There is so much unusual accounting in the March through May 2020 Bureau of Labor Statistics (BLS) job reports that we will have to handle them in multiple articles. In short, it is obvious that Eugene Scalia's BLS and Wilbur Ross's Census Bureau are going out of their way to steer the job numbers in Trump's favor. This, of course, is to be expected, as Trump's last stand for re-election is the performance of the economy.
For example, let's go back to March 8, 2019, when Trump received the worst jobs report in the Trump era, at that time. The BLS reported a paltry 20K job growth, and Trump replaced the BLS commissioner just five days later. Dr. William Beach, formerly the director of the Heritage Foundation's data analysis department, was made the new commissioner, and has been at it ever since.
We have noted suspicious BLS reporting under Trump twice before. One was the very suspicious January 2019 jobs report, as noted here. The second was the suspicious overcounting of jobs in 2019, as noted here.
But the impact of the pandemic on jobs has resulted in some extraordinary issues with the 2020 reports from March through May. Arguably, some issues are legitimate and understandable. But the BLS seems very dedicated to the singular goal of artificially reducing the reported unemployment rate.
The Shock of the May 2020 Jobs Report
The lead up to the publication of the May 2020 jobs report, published on June 5, was certainly looking bad for Trump. Just a few days earlier, the ADP National Employment Report for May reported a 2.76 million loss of private sector jobs. See ADP Report. (Note that ADP will retroactively change this estimate as they get more information, most notably from the BLS itself).
And ADP is no slouch when it comes to job counts. It is published monthly by Automatic Data Processing, which is a provider of payroll management systems, and has nearly 460,000 US clients representing 26 million workers. To add more fuel to the impending disaster of the May jobs report, Bloomberg’s consensus forecast was for a 7.5 million job loss.
And state unemployment insurance continuing claims jumped from 17.8 million in April to 18.9 million in May (for calendar weeks inclusive of the 12th day of the month). This pales in comparison to the number of people claiming benefits across all unemployment programs, which increased from 18.9 million in April to 30.2 million in May. See Unemployment Insurance Data here.
This was terrible news for Trump. On top of all his troubles with the demonstrations and the pandemic, now he was facing down another disastrous jobs report while Joe Biden was gaining strength in the swing state polls. State unemployment insurance claims went up 1.1 million. Total unemployment insurance claims skyrocketed by 11.3 million. (These numbers are based on the Department of Labor’s Unemployment Insurance Weekly Claims Data inclusive of the 12th of the month, which is the standard for BLS jobs reporting.)
How was Trump going to get out of this one? After all, he had faced down another huge job loss during the Federal government shutdown in January 2019. And he managed to get out of that one. But this was the pandemic. This was really big. He would need a miracle.
And he got one. That miracle was the May 2020 jobs report, produced by the BLS. It reported 2.5 million non-farm payroll job growth and an unemployment rate decrease from 14.7% in April to 13.3% in May. Truly suspicious because all the evidence was to the contrary.
The miracle of the May 2020 jobs report was certainly not the first suspicious 2020 jobs report. Both March and April have similar accounting issues, but they were at least directionally consistent with consensus expectations. But May stands apart as the single greatest surprise in the history of the jobs report.
It is also remarkable how much effort the BLS made in justifying their surprise. They knew this report would be questioned. And unlike the GOP, who were vociferous in their claims of tampering with the Obama era September 2012 jobs report, the Democrats have said almost nothing about the head scratching string of job reports that are obviously steering the numbers to favor Trump.
And unfortunately, the press rarely reports on anything but the Big Two stats, which are: nonfarm payroll job growth and the unemployment rate. And as a result, they are lambs led to slaughter at the hands of the BLS, which puts considerable effort into constructing politically expedient language and diverting more accurate job counts into more obscure reports distributed about on their web platform. We documented another case of this deceptiveness in 2019 here.
But back to 2020. While there are multiple issues with the 2020 job reports, for this analysis, we are going to focus on an accounting problem the BLS has acknowledged to have occurred five times in their history. Once in October 2013, once in January 2019, and three straight months in 2020, from March to May. And indeed, this will likely continue in the near future.
Misclassifying and Undercounting the Unemployed
The monthly “Employment Situation” report, or jobs report, is actually the conglomeration of two different surveys. One of these surveys is called the “establishment survey”, and it is just like it sounds. It surveys “establishments”, which can be businesses, government agencies, and other institutions that report payroll data to state and/or federal tax collectors. However, the unemployment rate does not come from the establishment survey.
It comes from the “household survey”. And the BLS is defensive about this in their May report. This defensiveness had been building since their March report, which they had already acknowledged to be undercounting unemployment. But what is the household survey?
According to the jobs report, the household survey is “a sample survey of about 60,000 eligible households conducted by the U.S. Census Bureau for the U.S. Bureau of Labor Statistics (BLS).”
Note that the BLS is not interviewing members of households regarding their employment status. The Census Bureau is. And the parent agency over the Census Bureau, the Department of Commerce, is run by Wilbur Ross. The BLS is under the Department of Labor, run by Eugene Scalia. If Trump wants to pressure the job reports in his favor, he’s got the right two guys to execute it. And with the pandemic’s crushing influence on jobs, they had their work cut out for them. And this work started with the March 2020 jobs report.
The Unemployment Misclassification Problem Begins in March
Beginning in March, the BLS noted a major problem with the misclassification of unemployed workers as employed. And these were not just small isolated errors from a few lowly census workers. These errors caused millions of people to be categorized as “employed”, when they were really “unemployed.”
The BLS estimates that the result was to shave about 1 percent from the March unemployment rate, 5 percent from April’s, and 3 percent from May’s. The BLS first describes the issue in the March jobs report, on page 5:
“However, there was also a large increase in the number of workers who were classified as employed but absent from work. Special instructions sent to household survey interviewers just before data collection started for March called for all employed persons absent from work due to coronavirus-related business closures to be classified as unemployed on temporary layoff. However, it is apparent that not all such workers were so classified. Such a misclassification is an example of nonsampling error and can occur when respondents misunderstand questions or interviewers record answers incorrectly. If the workers who were recorded as employed but absent from work due to “other reasons” (over and above the number absent for other reasons in a typical March) had been classified as unemployed on temporary layoff, the overall unemployment rate would have been almost 1 percentage point higher than reported. However, according to usual practice, the data from the household survey are accepted as recorded. To maintain data integrity, no ad hoc actions are taken to reclassify survey responses.”
So the people that were not at work due to the pandemic, and not paid, were erroneously recorded as employed. This occurred in spite of the “Special instructions” given to Wilbur Ross’s census workers on how to handle this particular case prior to doing the interviews. And with this advanced warning, how did they do?
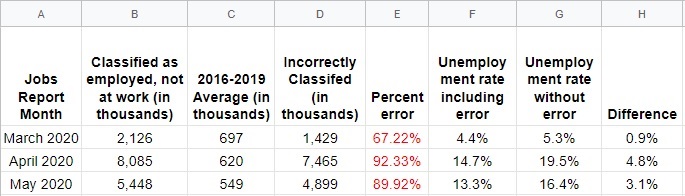
As seen in the table at the top, March 2020, the BLS estimated that 1.429 million unemployed people were misclassified as employed. Which constituted a 67% error rate of people in the category of not being at work for “other reasons”. So if you were not working, and not receiving a paycheck, despite the explicit instructions to assign such cases as unemployed, 67% of those cases were categorized as being employed. An honest mistake?
“Fixing” the Misclassification Issue by Making it Worse
Okay, so 67% of the “other employed” category, to the tune of 1.429 million people, were unemployed people misclassified as employed for March. Honest mistake, right? After all, the mistake only caused the unemployment rate to be understated by 0.9%, from 5.3% to 4.4%.
So let’s move to the next month, April, and see if this problem was corrected. After all, for March, the BLS had already given the Census Bureau workers “special instructions”. And they reiterated those instructions in April. So what was the result for April?
92% were misclassified, as seen above in Table 1. 25% higher than in March. They might have more success if they told them to do the opposite. And for April, the misclassification error caused 7.5 million unemployed people to be counted as employed. The BLS itself estimates that the correction of this issue would result in a 19.5% unemployment rate, instead of the officially reported 14.7%. See the BLS April FAQ Report, on page 11. The April report should have registered well over 20%, but this “error”, and some other suspicious errors we have yet to discuss, kept it well under.
May: It's Still Screwed Up?
Okay, census workers, we are not going to take this anymore. Enough is enough. In the BLS's May FAQs, which has interestingly been isolated from the main job report and into its own document, the BLS shows it isn’t messing around this time. Here’s what they say regarding this ongoing problem that has gotten much worse. And the BLS is finally pointing fingers:
“14. Household survey: What are BLS and the Census Bureau doing about the misclassification error?
BLS and our partners at the Census Bureau take the misclassification error very seriously, and we’re taking additional steps to address the problem.
Prior to the March data collection, instructions were provided to survey interviewers on how to answer the temporarily absent question if a person said that they had a job but did not work due to the coronavirus pandemic. (See item 8 above.) Prior to April data collection, an email was sent to all interviewers that included instructions with more detailed examples and a reference table to aid in coding responses. Prior to May data collection, every field supervisor had a conference call with the household survey interviewers they manage. In these conference calls, the supervisors went over the detailed instructions and examples and were available to answer interviewers’ questions.
We will continue to investigate the reasons why the misclassification error persists. In addition, we are making further changes prior to the June collection. The Census Bureau will conduct additional training to review the guidance. Also, we are embedding instructions into the data collection instrument to make them more accessible during survey interviews.” See page 11.
So the BLS appears to be trying to clean up the problem. Appears. In the above passage, the BLS is pointing the finger at Wilbur Ross’s census workers, who just can’t seem to get their collective acts together. According to their own verbiage, here is what they attempted to do to solve the problem:
March: provided instructions (presumably written) on how to count people as unemployed, which were people not working and not receiving paychecks.
Result: 67% of them classified as employed.
April: sent email containing instructions with more detail examples and a reference table on how to code people as unemployed.
Result: 92% classified as employed.
May: every field supervisor had a conference call with the census workers, and went over the detailed instructions and examples.
Result: 90% classified as employed.
And finally, the BLS writes: “We will continue to investigate the reasons why the misclassification error persists….” Oh.
We might be inclined to believe that the BLS is earnestly trying to fix the problem. However, that would be foolish. We have seen this behavior before. They are still trying to “determine the cause” of their "mysterious" overcounting of payroll jobs in 2019, which they have yet to figure out. See here.
The History of Misclassification
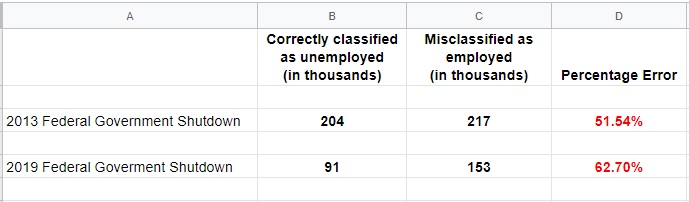
In their March 2020 FAQs, the BLS cites two other misclassification events as precedent. “A similar misclassification occurred with federal workers in both the 2013 and 2019 partial federal government shutdowns." See March FAQs, page 7.
Table 2: Historical Misclassification Error Rates
The Federal government shutdowns in 2013 and 2019 gave us two prior data points on this variety of misclassification problem. However, these were specific to Federal government employees. And the misclassification rate from the first time it happened, in October, 2013, was 52%.The next time a Federal shutdown happened, in January 2019, the BLS already had forewarning about the 2013 misclassification, and referenced it frequently in a supporting document. But they were apparently caught off guard in January 2019, as they make no reference on preparing for this situation. And their misclassification rate was 63%, 11% higher than the same issue that occurred under Obama.
But by March, 2020, they sent “special instructions” on how to avoid the misclassification. And the misclassification had jumped from 52% in October 2013, to 63% in January 2019, and to 67% in March 2020. And despite advertised attempts to correct the problem, it jumps to 92% in April, and to 90% in May.
Is This Deliberate?
Is this an innocent mistake? Made three months in a row? Are Wilbur Ross’s census workers deliberately skewing the data? Or is this just an understandable misclassification that happens to shave 3% to 5% off of Trump’s unemployment rate, in the year of the election?
Despite the BLS’s repeated “attempts” to get the Census Bureau to properly classify unemployed people, they started with a 67% misclassification rate in March and got worse in April, as it jumped to 92%. And April was when Trump needed it most. April was when the pandemic hit the employment market the hardest. And the misclassification shaved 5 percent from the unemployment rate, and kept it from hitting 20%.
And then in May, the census workers, after receiving a conference call about the issue, didn’t seem to change their behavior. The misclassification rate was 90%. Enough to shave off 3 percent from Trump’s unemployment rate, and drop it to lower than the previous month’s.
The BLS seems to be playing the victim with the misclassification problem, while doing some sly politicking just in case the issue actually gets greater scrutiny by the press, which is very unlikely. The press does very little research on the BLS jobs report, other than parroting the “big two” stats, which are the unemployment rate and non-farm payroll job growth.
Starting in March 2020, the BLS moved its “frequently asked questions” out of the main report, and into its own separate document. So determining what is really happening with the unemployment rate now requires the inspection of several different BLS documents. And the BLS puts some of their best stuff in their supplemental documents, such as this gem in the May FAQs:
“We will continue to investigate the reasons why the misclassification error persists. In addition, we are making further changes prior to the June collection. The Census Bureau will conduct additional training to review the guidance. Also, we are embedding instructions into the data collection instrument to make them more accessible during survey interviews.”
Other Issues with the Jobs Report
But the above issue, while highly suspicious, is far from the only issue that suggests the BLS is helping Trump with its approach to jobs accounting during the pandemic. An even larger issue are the people that have lost their jobs that have not actively looked for a job in the last four weeks, which is a criteria for counting them as unemployed. Instead, they are counted as “not in the labor force”.
And one might ask, in the wake of losing one’s job during a pandemic with stay at home orders, who would be actively looking for a job? But the BLS, which falsely claims that they simply follow their usual procedures month after month, counts these lazy freeloaders as not in the workforce, and they even estimate their impact on the unemployment rate in the FAQs for May 2020 (page 13).
“Relative to earlier months, the large number of people who wanted a job in April and May likely reflects the impact of the pandemic on the job market, as mandatory business closures, stay-at-home orders, and concerns about the coronavirus may have kept many individuals from engaging in labor market activity. Most people who wanted a job in April and May had not looked for work recently. If they had actively looked for work in the prior 4 weeks and were available to take a job, they would have been counted among the unemployed.If all people who want a job but were not in the labor force were added to the total 21.0 million people unemployed in May, the resulting 29.9 million people would represent 17.9 percent of the combined total of the labor force plus those who want a job. A similar calculation results in 19.8 percent for April and 7.5 percent for March.”
An interesting thing to note here is that the BLS isolates this issue from the misclassification issue in recomputing the unemployment rate. They do not combine the two issues together to recompute the famous statistic. Why? Well, let’s see what it would do to the unemployment rate if they did. April would have been reported at 24.6%, and May would have been 21%. Instead, Trump got 14.7% and 13.3%. Quite a difference, as the BLS seems determined to keep it under the magic 20% number.
Now the BLS’s justification for not correcting the misclassification data or adjusting their “four week” criteria for counting someone as unemployed during the pandemic is the same justification. They basically assert that these are their regular accounting procedures, and they do not vary from them.
But we have already seen this not to be true, when back in January 2019, they made a very big change to their standard accounting procedures to avert a disastrous jobs report in the wake of the government shutdown. They were more than happy to change their standard procedures to accommodate Trump. See here.
More to Come
But there is more to show you, and Part 4 in this series will focus on several other strange and obscure BLS anomalies to several other components of the 2020 job counts, such as procedural changes to their business birth-death model, changes to their seasonal adjustment algebra, and some strange behavior in the Unemployment Weekly Claims Report, which is published by Wilbur Ross’s Department of Labor.
Curtis Laforge, June, 2020
Laforge@apoenian.org